

03.20.2018
As the 2018 midterm elections approach, women and especially college graduates have moved toward the Democratic Party. By contrast, the Republican Party’s advantage in leaned party identification among white voters without a college degree has never been greater, dating back more than two decades.
While partisanship among voters usually does not change much on a yearly basis, some differences have widened over time, especially by educational attainment, gender and age. And these gaps are even larger when categories are combined, such as education, race and gender.

A new analysis of party identification, based on more than 10,000 interviews of registered voters conducted by Pew Research Center in 2017, finds that 37% of registered voters identify as independents, 33% are Democrats and 26% are Republicans.
Most independents lean toward one of the major parties; when their partisan leanings are taken into account, 50% of registered voters identify as Democrats or lean toward the Democratic Party, while 42% identify as Republicans or lean toward the GOP. While the overall balance of leaned party affiliation has not changed much in recent years, this is the first time since 2009 that as many as half of registered voters have affiliated with or leaned toward the Democratic Party.
Since 2014, the last midterm election year, there have been notable changes in party identification among several groups of voters. And as we noted in our 2016 report on party affiliation, the composition of the Republican and Democratic electorates are less alike than at any point in the past quarter-century.
Persistent gender gap. For decades, women have been more likely than men to identify as Democrats or lean Democratic. But today, a 56% majority of women identify as Democrats or lean Democratic, while 37% affiliate with or lean toward the GOP. The share of women identifying as Democrats or leaning Democratic is up 4 percentage points since 2015 and is at one of its highest points since 1992. Among men, there has been less recent change: 48% identify with the Republican Party or lean Republican, while 44% are Democrats or lean Democratic. That is comparable to the balance of leaned party identification since 2014.
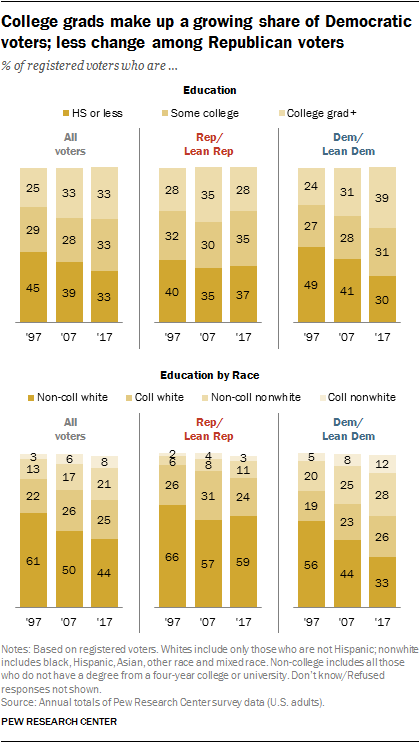
Record share of college graduates align with Democrats. Voters who have completed college make up a third of all registered voters. And a majority of all voters with at least a four-year college degree (58%) now identify as Democrats or lean Democratic, the highest share dating back to 1992. Just 36% affiliate with the Republican Party or lean toward the GOP. The much larger group of voters who do not have a four-year degree is more evenly divided in partisan affiliation. And voters with no college experience have been moving toward the GOP: 47% identify with or lean toward the Republican Party, up from 42% in 2014.
Continued racial divisions in partisan identification. About half of white voters (51%) identify with the GOP or lean Republican, while 43% identify as Democrats or lean Democratic. These figures are little changed from recent years. By contrast, African American voters continue to affiliate with the Democratic Party or lean Democratic by an overwhelming margin (84% Democrat to 8% Republican). Hispanic voters align with the Democrats by greater than two-to-one (63% to 28%), while Asian American voters also largely identify as Democrats or lean Democratic (65% Democrat, 27% Republican).
Larger differences among whites by education. Most white voters with at least a four-year college degree (53%) affiliate with the Democratic Party or lean Democratic; 42% identify as Republicans or lean Republican. As recently as two years ago, leaned partisan identification among white college graduates was split (47% Democrat, 47% Republican). Majorities of white voters with some college experience but who do not have a degree (55%) and those with no college experience (58%) continue to identify as Republicans or lean Republican.
Millennials, especially Millennial women, tilt more Democratic. As noted in our recent report on generations and politics, Millennial voters are more likely than older generations to affiliate with the Democratic Party or lean Democratic. Nearly six-in-ten Millennials (59%) affiliate with the Democratic Party or lean Democratic, compared with about half of Gen Xers and Boomers (48% each) and 43% of voters in the Silent Generation. A growing majority of Millennial women (70%) affiliate with the Democratic Party or lean Democratic; four years ago, 56% of Millennial women did so. About half of Millennial men (49%) align with the Democratic Party, little changed in recent years. The gender gap in leaned party identification among Millennials is wider than among older generations.
Long-term changes in partisan composition
The nation’s changing demographics – and shifting patterns of partisan identification – have had a profound impact on the makeup of the Democratic and Republican electorates.
Across several dimensions – race and ethnicity, education and religious affiliation – the profile of Democratic and Democratic-leaning registered voters has changed a great deal over the past two decades. The composition of Republican and Republican-leaning voters has shown less change.

While a majority of voters (69%) are white non-Hispanics, nonwhite voters now make up an increasing share of all voters: 29% of registered voters are African American, Hispanic or Asian American or belong to another race, up from 16% in 1997. Nonwhites constitute nearly four-in-ten Democratic voters (39%), compared with 24% two decades ago. The GOP coalition also has become more racially and ethnically diverse, but nonwhites make up only 14% of Republican voters, up from 8% in 1997.
The educational makeup of the two parties’ electorates also has changed substantially over the past two decades. When race and education are taken into account, white voters who do to not have a college degree make up a diminished share of Democratic registered voters. White voters who do not have a four-year degree now constitute just a third of Democratic voters, down from 56% two decades ago. By contrast, non-college white voters continue to make up a majority of Republican and Republican-leaning registered voters (59% now, 66% in 1997).
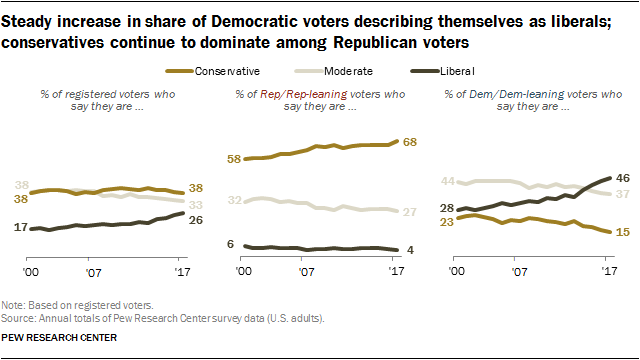
Growing share of Democrats describe their views as ‘liberal’
The share of Democratic voters describing their political views as liberal has increased steadily since 2000. Republicans’ ideological views have changed little over past decade, but the share of Republicans identifying as conservatives rose between 2000 and 2008.
Currently, nearly half of Democratic and Democratic-leaning registered voters (46%) say they are liberal, while 37% identify as moderates and 15% say they are conservatives. A decade ago, more Democrats described their views as moderate (44%) than liberal (28%), while 23% said they were conservative.
Conservatives have long constituted the majority among Republican and Republican-leaning registered voters. Roughly two-thirds of Republicans (68%) characterize their views as conservative, while 27% are moderates and 4% are liberals. While there has been little change in Republicans’ self-described ideology in recent years, the share calling themselves conservatives rose from 58% in 2000 to 65% eight years later.
1. Trends in party affiliation among demographic groups

The balance of partisan affiliation – and the combined measure of partisan identification and leaning – has not changed substantially over the past two decades. However, Democrats hold a slightly larger edge in leaned party identification over Republicans now than in 2016 or 2015.
In Pew Research Center surveys conducted in 2017, 37% of registered voters identified as independents, 33% as Democrats and 26% as Republicans. When the partisan leanings of independents are taken into account, 50% either identify as Democrats or lean Democratic; 42% identify as Republicans or lean Republican.
The 8-percentage-point Democratic advantage in leaned partisan identification is wider than at any point since 2009, and a statistically significant shift since 2016, when Democrats had a 4-point edge (48% to 44%). The analysis in this report draws on more than 10,000 interviews with registered voters in 2017 and tens of thousands of interviews conducted in previous years.
There continue to be fundamental differences in the partisan orientation of different demographic groups, and in many cases these gaps have grown wider in recent years. For instance, gender, generational, geographic and educational divides are now as wide, or wider, than in Pew Research Center surveys going back more than two decades.
Wide gender gap in partisanship

As has been the case for more than two decades of Pew Research Center surveys, women are significantly more likely than men to associate with the Democratic Party. While the gender gap has changed little in recent years, it is as wide as it has been at any point during this period: Among registered voters, 56% of women affiliate with or lean toward the Democratic Party, compared with 44% of men.
From 2010 through 2015, about half of women (51%-52%) identified with or leaned toward the Democratic Party. But the share of women who identify with or lean to the Democratic Party has risen in recent years, to 54% in 2016 and 56% in 2017. The partisan breakdown of men is relatively unchanged over this period.
The Democratic gains among women have not come from increased affiliation with the party. Overall, the proportion of women voters who identify with (rather than lean toward) the Democratic Party has remained relatively constant for the past 25 years (in 1994, 37% of women said they identified with the Democratic Party, compared with 39% in 2017).
Black, Hispanic and Asian voters remain overwhelmingly Democratic

There are sizable and long-standing racial and ethnic differences in partisan affiliation, and they have shifted only modestly in recent years.
White voters continue to be somewhat more likely to affiliate with or lean toward the Republican Party than the Democratic Party (51% to 43%).
Since 2010, white voters have been more likely to align with the GOP than with the Democrats. However, the share of whites identifying as Democrats or leaning Democratic has edged upward (43% now, up from no more than 40% from 2009 to 2016). This growth is attributable to a slight increase in Democratic-leaning independents, rather than a rise in Democratic affiliation.
By contrast, African American voters remain overwhelmingly Democratic: 84% identify with or lean toward the Democratic Party. Just 8% of black voters identify in some way with the Republican Party.
While black voters remain solidly Democratic, identification with the Democratic Party has declined modestly in recent years: About two-thirds of African Americans have identified as Democrats in the last several years, down slightly from the first half of Barack Obama’s presidency, when about three-quarters affiliated with the Democratic Party.
By more than two-to-one (63% to 28%), Hispanic voters are more likely to affiliate with or lean toward the Democratic Party than the GOP. The overall balance of partisan orientation among Hispanics is little changed over the last decade.
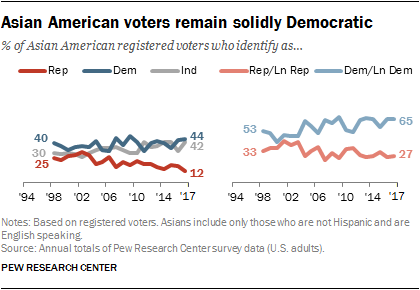
There is a similar balance of partisanship among Asian American registered voters: 65% identify with the Democratic Party or lean Democratic, compared with 27% who identify as or lean Republican.
In 1998 (the first year for which sample sizes of Asian American voters were sufficiently large enough in Pew Research Center surveys), 53% of Asians identified with or leaned toward the Democratic Party and 33% identified with or leaned toward the Republican Party. (Note: Only English-speaking Asian American voters are included in the data).
The share of Asian American voters who identify as Republican is now only 12%. While this is little changed in the last few years, it represents the continuation of a longer trend in declining Republican affiliation among Asian voters. Among Asians, identification with the Democratic Party has remained relatively stable over this period. The share of Asian voters who say they are political independents has risen steadily since 1998, reflecting a more general trend among all voters.
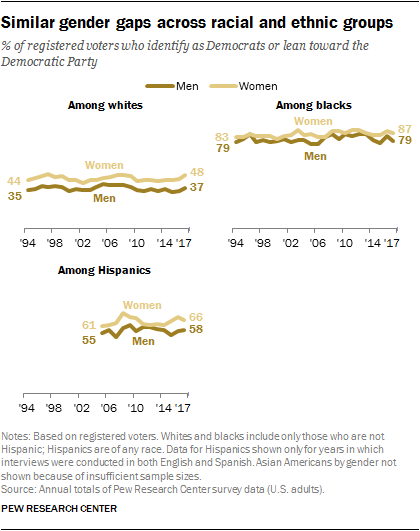
A gender gap in partisan affiliation and leaning is seen across racial and ethnic groups.
For instance, there is a 9-percentage-point gender gap among white voters: While 48% of white women affiliate with or lean toward the Democratic Party, 37% of white men do so. Similarly, there is an 8-point gender gap among black voters (87% of black women vs. 79% of black men), as well as among Hispanic voters (66% of women vs. 58% of men).
Educational gap in partisan orientation continues to grow
Higher educational attainment is increasingly associated with Democratic Party affiliation and leaning. At the same time, those without college experience – once a group that tilted more Democratic than Republican – are roughly divided in their partisan orientation.
These twin shifts have resulted in the widest educational gap in partisan identification and leaning seen at any point in more than two decades of Pew Research Center surveys.
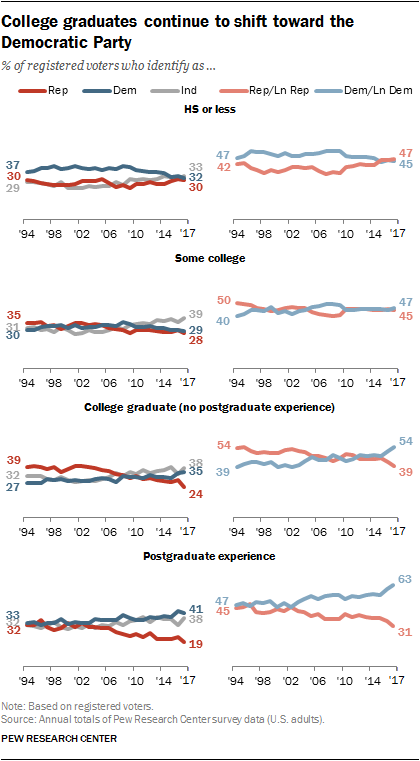
In 1994, 39% of those with a four-year college degree (no postgraduate experience) identified with or leaned toward the Democratic Party and 54% associated with the Republican Party. In 2017, those figures were exactly reversed.
Democratic gains have been even more pronounced among those who pursue postgraduate education. In 1994, those with at least some postgraduate experience were evenly split between the Democratic and Republican parties. Today, the Democratic Party enjoys a roughly two-to-one advantage in leaned partisan identification. While some of this shift took place a decade ago, postgraduate voters’ affiliation with and leaning to the Democratic Party have grown substantially just over the past few years, from 55% in 2015 to 63% in 2017.
By contrast, Republicans have been gaining ground over the past several years with those who do not have bachelor’s degrees. Among those with no more than a high school education, 47% affiliate with the GOP or lean Republican, while 45% identify as Democrats or lean Democratic. Democrats held a significant advantage among voters with a high school degree or less education for much of the late 1990s through early 2000s, and as recently as 2014 (47% Democratic, 42% Republican).

These overall patterns in education and partisanship are particularly pronounced among white voters. While the GOP has held significant advantages over the Democratic Party among white college graduates without postgraduate experience over much of the past two decades, these voters are divided in their partisanship today.
In 2017, 49% of white voters with a college degree (and no additional education) aligned with the Democratic Party, compared with 46% for the GOP. As recently as 2015, 51% of white voters with a college degree aligned with the Republican Party, compared with 43% for the Democratic Party.
And among voters with postgraduate experience, the Democratic advantage has grown. In 2017, 59% of white voters with at least some additional education beyond a four-year degree identified as Democrats or leaned Democratic, while 37% identified with or leaned toward the Republican Party; as recently as 2015 that balance was slightly narrower (52% to 41%).
By contrast, white voters with no more than a high school education have moved more to the GOP over the last 10 years, though there has been little change since 2015. As recently as 2009, these voters were divided in leaned partisanship. Since then, Republicans have held significant advantages, including a 23-percentage-point lead in 2017 (58% Republican, 35% Democratic).
A wide – and growing – generational divide in partisanship

The generational gap in partisanship is now more pronounced than in the past, and this echoes the widening generational gaps seen in many political values and preferences.
Millennial voters (born 1981 to 1996) have had a Democratic tilt since they first entered adulthood; this advantage has only grown as they have aged.
Democrats enjoy a 27-percentage-point advantage among Millennial voters (59% are Democrats or lean Democratic, 32% are Republican or lean Republican). In 2014, 53% of Millennial voters were Democrats or leaned Democratic, 37% tilted toward the GOP.
Millennials remain more likely than those in older generations to call themselves independents (44% vs. 39% of Gen Xers, 32% of Boomers and 27% of Silents); still, the roughly two-to-one Democratic advantage among Millennials is apparent both in “straight” and “leaned” partisan affiliation.
Generation X voters (born 1965 to 1980) are more divided in their partisan attachments, but also tilt toward the Democratic Party (48% identify as or lean Democratic, 43% identify as or lean Republican). The balance of leaned partisan identification among Gen X voters has been relatively consistent over the past several years. Baby Boomer voters (born 1946 to 1964) are nearly evenly divided (48% identify as or lean Democratic, 46% Republican).
The Silent Generation (born 1928 to 1945) is the only generational group that has more GOP leaners and identifying voters than Democratic-oriented voters. About half (52%) of Silent Generation voters identify with or lean toward the Republican Party, a larger share than a decade ago; 43% identify with or lean toward the Democratic Party.
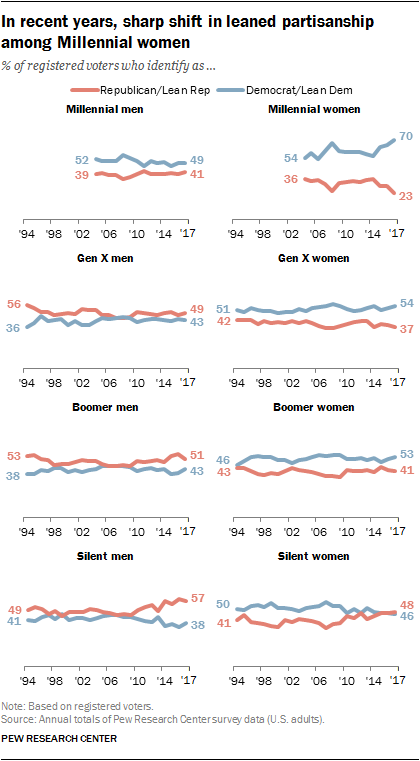
While there is a gender gap in partisan affiliation within every generational cohort, it is particularly pronounced among Millennial voters. A large majority of Millennial women (70%) identify with or lean toward the Democratic Party, compared with 49% of Millennial men.
This wide gender gap among Millennial voters is largely attributable to a marked shift among Millennial women. As recently as 2014, the Democratic advantage among Millennial women was a narrower – but still substantial – 21 percentage points, compared with 47 points today. The balance of partisanship among Millennial men was similar in 2014 as it is today (50% Democratic vs. 40% Republican).

Gender gaps in other generations are more modest. For instance, 57% of Silent Generation men identify with or lean toward the GOP, compared with 48% of Silent women.
Across all generations, nonwhite voters are overwhelmingly Democratic in their leanings, while whites are more divided. Among white voters, Millennials are the only generation in which the share of Democrats and Democratic leaners (52%) is greater than the share of Republicans and Republican leaners (41%).
Among older generations of whites – but particularly among white Silents – more voters align with the GOP than the Democratic Party.
White Silent Generation voters have moved toward the GOP in recent years. Today, 59% identify with or lean to the GOP, up from 43% a decade ago.
White Gen Xer and Boomer voters have remained relatively stable in their partisan makeup in recent years. In both generations, the GOP enjoys a similar modest advantage (11 percentage points among white Gen Xers, 12 points among white Boomers); these are similar to the balances in 2014.
Religious affiliation and party identification

White evangelical Protestants remain one of the most reliably Republican groups of voters, and the GOP’s advantage among this segment of the population has continued to grow in recent years: 77% of white evangelical voters lean toward or identify with the Republican Party, while just 18% have a Democratic orientation.
White mainline Protestant voters are more divided in their political identities. As has been the case for the last several years, a narrow majority (53%) affiliates with or leans to the GOP, while 41% lean toward or identify with the Democratic Party.
Black Protestant voters remain solidly Democratic in their partisan loyalties. Almost nine-in-ten (87%) lean toward or identify with the Democratic Party.

Overall, Catholic voters are roughly evenly split between the share who identify with or lean to the Republican (46%) and Democratic (47%) parties. But white Catholics and Hispanic Catholics diverge politically.
White Catholic voters now are more Republican (54%) than Democratic (40%). While the partisan balance among white Catholic voters is little changed in recent years, this group was more evenly divided in their partisan loyalties about a decade ago.
Hispanic Catholics, who represent a growing share of the Catholic population in the U.S., are substantially more Democratic in their orientation (64% of Hispanic Catholic voters affiliate with or lean to the Democratic Party, 27% to the GOP).

While Mormon voters remain a solidly Republican group (72% overall are Republican or Republican leaning), in recent years Mormons have been less likely to identify asRepublican than in the past.
Mormon voters are now about as likely to identify as independent (41%) as they are to identify as Republican (45%). For most of the past two decades, majorities of Mormons called themselves Republicans.

By about two-to-one, Jewish voters continue to identify with or lean toward Democratic Party (67% vs. 31% who identify with or lean Republican). This balance is little changed over the last decade.

The religiously unaffiliated, a growing share of the population, have shown steady movement in orientation toward the Democratic Party. In 1994, about half (52%) of religiously unaffiliated voters leaned toward or identified with the Democratic Party. Today nearly seven-in-ten (68%) do so.
Urban voters grow more Democratic, rural voters more Republican
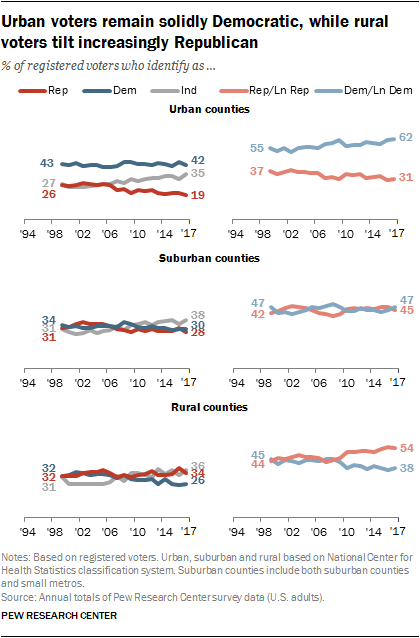
Voters in urban counties have long aligned more with the Democratic Party than the Republican Party, and this Democratic advantage has grown over time. Today, twice as many urban voters identify as Democrats or lean Democratic (62%) as affiliate with the GOP or lean Republican.
Overall, those who live in suburban counties are about evenly divided in their partisan loyalties (47% Democratic, 45% Republican), little changed over the last two decades.
Voters in rural areas have moved in a more Republican direction over the last several years. From 1999 to 2009, rural voters were about equally divided in their partisan leanings. Today, there is a 16-percentage-point advantage for the GOP among rural voters.
While there are racial and ethnic differences in the makeup of rural, suburban and urban areas, this overall pattern of geographic divergence is also seen among whites. Among rural whites, the GOP enjoyed a roughly 10-percentage-point advantage throughout much of the 2000s; the GOP advantage among rural white voters is now 24 percentage points (58% to 34%). At the same time, while urban white voters were roughly evenly divided in their political preferences for much of the last two decades, in recent years the Democratic Party has enjoyed a double-digit partisan advantage: Today, 54% of white urban voters are Democrats or lean Democratic, while 41% identify with the GOP or lean Republican.
2. Changing composition of the electorate and partisan coalitions

The demographic profile of voters has changed markedly in recent years, reflecting broader changes in the nation. The electorate is more racially and ethnically diverse than in the past. Voters also are older and better educated than they were two decades ago.
Overall, while non-Hispanic whites remain the largest share of registered voters (69%), their share is down from 83% in 1997. African Americans make up 11% of voters, a share that has changed little since then.
Hispanics constitute a much larger share of registered voters today (10%) than in the late 1990s (4% in 1997), though there has been relatively little change over the past decade. Asian Americans, who made up a tiny share of voters 20 years ago, now constitute 2% of voters. And voters who describe their race as “other” also make up a larger share of the electorate than in the past (5% today).
The overall growth in the racial and ethnic diversity of voters has changed the composition of both the Republican and Democratic parties. Yet the pace of change has been more pronounced among Democrats and Democratic leaners.
White registered voters make up a declining share of the Democratic Party. In 1997, 75% of Democratic and Democratic-leaning registered voters were white; that has dropped to a smaller majority today (59%). Nonwhite voters now make up about four-in-ten Democratic voters (39%), up from 24% in 1997.
Republican and Republican-leaning voters continue to be overwhelmingly white: 83% of Republican registered voters are white non-Hispanics, compared with 92% in 1997. The share of Republicans who are nonwhite increased from 8% to 14% over this period.
The electorate continues to grow older, impacting the age composition of Democratic and Republican voters. In 1997, the median age of all registered voters was 45; today the median age has risen to 50.
Nearly six-in-ten Republican and Republican-leaning voters (57%) are ages 50 and older, compared with 42% who are under 50. Among Democratic voters, a larger share are younger than 50 (53%) than 50 and older (46%).
Twenty years ago, the age profiles of the two parties were much more similar. At that time, comparable majorities of both parties’ voters were younger than 50 (61% of Republicans, 57% of Democrats).
In 1997, the median age of Republican voters was 43, while the median age of Democratic voters was 46. Today, the median age of Republican voters has increased nine years, to age 52, while the median age of Democratic voters has edged up to 48.
Parties’ educational profiles diverge
Over the past 20 years, the American electorate has become better educated, with the share of college graduates rising. In 1997, 45% of all registered voters had no college experience; today that share has fallen to 33%.
And while those with no college experience was the largest category of voters two decades ago, today the electorate is evenly divided – a third each are college graduates, have some college experience but no degree and have no more than a high school diploma.
Despite these shifts, Republican and Republican-leaning voters are no more likely to be college graduates than was the case two decades ago. And college graduates make up a smaller share of GOP voters than they did a decade ago.
Today, 28% of Republican voters have at least a four-year college degree; 35% have some college experience but no degree; and 37% have no college experience.
The educational composition of GOP voters is similar to what it was in 1997. At that time, 28% were at least college graduates; 32% had some college experience; and 40% had no more than a high school education. And in 2007, college graduates made up a greater share of Republican voters than is currently the case (35% of all GOP voters then, 28% now).
The educational makeup of Democratic voters has changed substantially over the past 20 years. Today, about four-in-ten Democrats (39%) have at least a college degree, up from 24% in 1997. And while voters with no more than a high school education constituted the largest share of Democratic voters 20 years ago, today college graduates make up the largest share.
Whites without a college degree remain the largest share of all registered voters, but their numbers have been on the decline due to growing diversity and rising levels of education in the population. In 1997, a majority of all registered voters (61%) were whites without a college degree. Over the past 20 years, that share has fallen to 44%.
The share of whites with at least a college degree has edged up from 22% of registered voters in 1997 to 25% today. Among nonwhites, the share with a college degree or more education has more than doubled, from just 3% in 1997 to 8% in 2017. And nonwhites without a college degree make up a much larger proportion of the electorate today (21%) than 20 years ago (13%).
Combining race and education, Democratic voters are very different today than they were 20 years ago. Today, non-college whites make up a third of all Democratic voters; they constituted a majority of Democrats (56%) in 1997. Since then, the share of white Democrats with at least a four-year degree has increased from 19% to 26%, and the share of nonwhite Democratic college graduates has more than doubled (from 5% to 12%).
Whites who do not have a four-year college degree continue to make up a majority of Republican voters, though a smaller majority than 20 years ago (59% now, 66% then). Whites with at least a four-year degree constitute about a quarter of Republican voters (24%), little changed from 1997 (26%).
Religiously unaffiliated voters make up increasing share of Democrats

The nation’s religious landscape has undergone major changes in recent years, with the share of the population who identify as Christian declining as the number of adults who do not identify with a religion has grown.
Religiously unaffiliated voters, who made up just 8% of the electorate two decades ago, now constitute about a quarter (24%) of all registered voters. Over this period, there have been declines in the shares of white mainline Protestants, white evangelical Protestants and white Catholics.
Religiously unaffiliated voters now account for a third of Democratic voters, up from just 9% in 1997. In fact, they make up a larger proportion of Democrats than do white Protestants (33% vs. 18%). In 1997, 40% of Democratic voters identified as white Protestants (evangelical or mainline), while just 9% were religiously unaffiliated. And white Catholics, who made up about one-in-five Democrats then (22%), account for only 10% of Democrats now.
Republicans continue to be mostly made up of white Christians: A third of Republican voters are white evangelical Protestants, which is little changed from 1997 (34%); 17% are white mainline Protestants (28% in 1997); and 17% are white Catholics (20% then).
While religiously unaffiliated voters constitute a much smaller segment of Republican than Democratic voters, the share of Republicans who do not identify with a religious denomination has risen. Currently, 13% of Republicans do not identify with a religion, up from 5% two decades ago.
Originally published by Pew Research Center, reprinted with permission.