Analyzing the evolution of the map of the world in the 20th century, from the Navy League map of 1901 to a digital world view a century later.

By Tom Harper
Lead Curator of Antiquarian Mapping
British Library
Introduction
Maps have been around for centuries, but the 20th century was a golden age of map-making. It was the first period of near-universal map literacy, when maps proliferated and permeated almost every aspect of daily life. Maps accompanied every stage of a century overshadowed by war, yet marked by tremendous social and technological change.
They appeared in wonderful variety, from traditional maps drawn by hand onto paper, to photographs of the Earth taken from satellites; from the conventional image of the world from above, to the dynamic distortion of the modern London Underground map. Maps introduced the elements which shaped 20th century life.
The Earliest Types of World Maps
The world has been represented in maps for many centuries. The earliest surviving world images from the 7th century appear more like symbols or circular diagrams to us today.

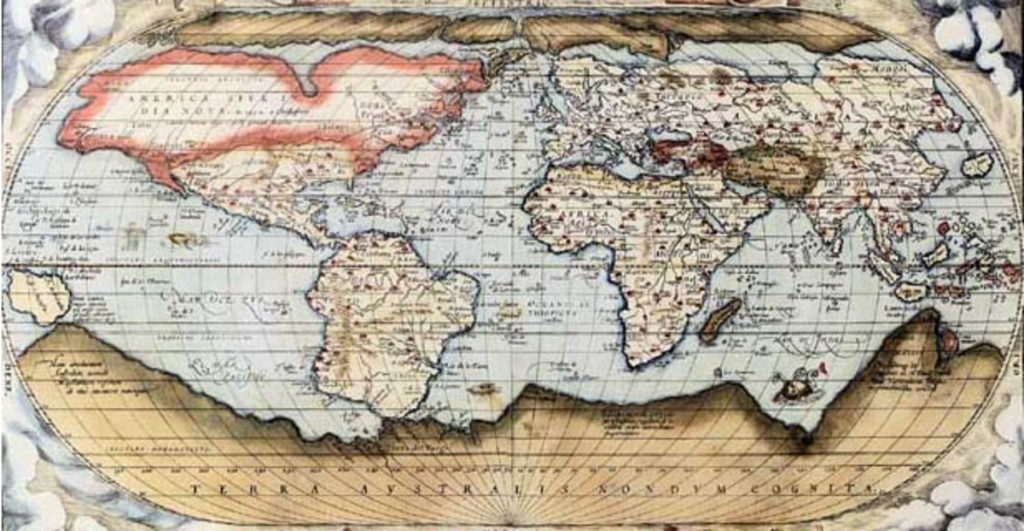
More detailed maps with quantities of names and topographical features began to predominate from around the 12th century. The Western world map format we recognise today has become most strongly associated with the Flemish geographer, Gerhard Mercator.
Mercator’s 1569 world map was the first map to showcase his map projection (a set of mathematical calculations to translate the 3D world onto a 2D surface). Mercator’s solution for flattening the globe was to gradually increase the gaps between the parallels or lines of latitude as they approached the poles (the calculation also enabled sailors to plot straight courses directly on the map). This is why the northern and southern parts of maps on Mercator’s projection look so large compared to land situated along the equator.
Today there are only three complete surviving copies of Mercator’s world map. However, small sections of the world map were included by Mercator in his hand-crafted atlas of Europe which he made in 1570 and 1571 for his patron Werner von Gymnich.

One of the earliest maps to be drawn on Mercator’s projection was a world map by the Englishman Edward Wright, published in a book of 1599 which celebrated the achievements of English explorers such as Francis Drake (who had circumnavigated the world between 1577 and 1580).
Mercator’s map and projection remained the standard world vision into the 20th century.
How the Map of the World Changed in the 20th Century
Over the course of the 20th century, momentous changes in the world were manifested in world maps. For example, new and more numerous states were created following the ends of wars and the decline of European empires.
A general increase in quantity and type of information found its way onto maps. But other changes affected world maps more profoundly than an increase or alteration in their content. What had become fundamental principles of world maps, such as what was placed at their centres or how they corresponded with reality, came into question as mapmakers attempted to adapt them to a brave new world.
Below we examine a sequence of 20th century world maps, noting patterns of change from one to the other, and assessing their value as windows on the past.
The Navy League and the Purpose of Their Map

The Navy League was an imperialist pressure group established in 1894 to promote the continuing centrality of the Royal Navy in the minds of the British and dominion governments.
The Navy was seen as the glue that bound together Britain’s array of territories and dominions. It was the world’s largest fleet, guaranteed by the 1889 Naval Defence Act (which decreed that it was to be at least as large as the next two biggest fleets combined). But by 1901 it faced competition from rapidly expanding German and Japanese navies.
The map above was an effective propaganda piece which enabled the Navy League to promote continuing investment in the Navy. It would also have been a prominent fixture in school classrooms and fixed the image of empire in the minds of impressionable schoolchildren. The fact that it is dedicated to ‘the children of the British Empire’ proves its intended appeal to those future administrators of the Empire.
National Minorities and Statehood

The world image of European imperialism was cleverly subverted in this world map published in Germany in around 1919. The defeat of Germany and her allies at the end of World War I in 1918 was followed by a series of peace conferences including that held at the Palace of Versailles near Paris.
Amongst the terms imposed on Germany by the victorious Entente (led by Britain, France and the USA) was the loss of her overseas territories: Namibia, the Marshall Islands and others, which were redistributed amongst the victorious Allies, with Britain doing particularly well in receiving former German possessions.
One of the key principles promoted at the conference by the American president Woodrow Wilson was that of ‘self-determination’ for national minorities. This principle allowed minorities the right to claim statehood for themselves, and to have the protection of a League of Nations, the establishment of which was another of Wilson’s ideas.
After the end of the War, various states had been created out of former empires including the Austro-Hungarian and Ottoman Empires.
The German world map outline takes issue with the principle of self-determination set against the loss of German colonies. It shows the ‘Entente’ countries of Britain, the United States, France and Russia (the latter had left the War in 1917) as figures in national dress, each holding the reigns of their colonies which are shown as the national beast. What of these territories, the poster asks, if the commitment to allowing nations the right to independent self-rule is legitimate? Double standards it certainly appeared to a German audience.
Empire of Free Trade

Britain’s empire remained crucially important to the national economy, particularly after the 1929 American stock market crash and subsequent slump which dragged the global economy, tied to the dollar, into depression.
The existence of this 1932 British War Office world chart demonstrated that there were official British concerns over Britain’s reliance on international shipping and the potential threats this posed.
During the global slump of the early 1930s the British Foreign Office and War Office waged a major propaganda campaign for the extension of Empire Tree Trade, hoping to create amenable trade conditions within the British Empire. The Empire Marketing Board (1929–33) commissioned maps and posters from artists such as MacDonald Gill for the same end.
The problem for Britain was that dominions like Canada and New Zealand desperately needed to protect their own industries, even from Britain, and thus were not willing to lower tariffs and expose themselves to the global economic storms.
Post-World War II Maps of the World: An American View

Rearmament by Germany, Italy and Japan – and the states opposing them – proved to be a factor in ending the global economic slump. Amidst the global conflict of World War II, people were already planning for peace. World maps were used to speculate upon what the world might look like following the end of hostilities.
Gomberg based his map on principles developed by politicians and authors including HG Wells. They advocated a morally just peace settlement at the end of the War, with a proper international ‘moral world order’ ensuring global protection and prosperity.
The map’s reorganisation of the world provides a number of ‘what-if’ moments for the modern viewer. But it has also been taken out of context. For example, the map has been viewed in some quarters as evidence of American imperial ambitions.
Great swathes of the world are displayed as blue, under USA protection, whilst the so-called ‘peace security outposts’ could just as easily be seen in the same light. However, such a policy would have contradicted United States presidents’ open and repeated criticism of European empires.
The Meaning behind the United Nations Emblem

Two maps produced after the end of World War II give contrasting perspectives on the reality of peace set against the political divisions of the emerging Cold War. The first, a United Nations (UN) map created in 1945, centring on the North Pole, represented the first to move away from the traditional style with Europe at the centre. The centre features a neutral space, bordered by a number of states, providing a sense of unity and co-operation.
While this map was intended to be a symbol of peace and unity, another map on the same projection, produced some four years later, displayed international relations in an altogether different light.
How Cold War Tensions Were Reflected in World Maps

After the War, the United States did retain a military presence in Japan and South East Asia, and in Western Europe through membership of the North Atlantic Treaty Organisation (NATO) in 1949. In answer to the formation of NATO, the Soviet Union and her allies formed the Warsaw Pact, which assured its members of military support if threatened – the two sides of the emergent Cold War were set.
Within this map, procured from the Ministry of Defence (MoD), the use of the UN logo reflects the uncertainty and suspicion which existed between the USA (with its allies) and the Soviet Union.
The distance between these two powers was smaller at the North Pole; a Soviet pilot made the first journey in 1937. The particular marking on the map of ‘areas of Soviet domination or influence’ demonstrates British wariness over its former wartime ally. Here, close proximity did not provide an excuse for co-operation.
The World Map from Space

The 20th century witnessed a dramatic shift in human perception of the Earth, because for the first time in history people could travel into space and stare at the world with their own eyes. ‘Earthrise’, an image captured by NASA astronaut Bill Anders in 1968, has something in common with those early medieval circular world maps we listed earlier; not so much because of how it looks, but because of its almost spiritual symbolism.
The photograph appeared in newspapers and magazines across the world, acquiring a number of meanings and coming to represent ‘earthly’ issues. For instance, because the Earth looked small, alone and vulnerable in a void, uniting and optimistic messages were evoked, such as ‘whole world’ and ‘one Earth’ discourses.
Yet despite the peaceful connotations of the image, Cold War motivations lurked in the background. The photograph may have come to signify world togetherness, but it also represented an American triumph in the ongoing ideological war against the Soviet Union.
Today’s Western World Map Outline

Space travel and the first moon landing of 1969, was just one of the events that made the 1960s a watershed decade. Changes occurred to Western society that could not have been contemplated before World War II, including effects of decolonisation, the social contract, the empowerment and commercialisation of youth, environmentalism and civil rights.
For many people, the traditional world map drawn on Mercator’s projection with Europe at the centre no longer tallied with the world they recognised. So how did the Western map of the world that we’re now accustomed to come to pass?
A German historian named Arno Peters attempted to put things right. Peters’ choice of an equal area map projection was highly intentional because it made the equatorial zone areas including Africa appear far larger than in the Mercator projection, which Peters claimed distorted ‘the picture of the world to the advantage of the colonial masters of the time’.
Mercator’s map had certainly enlarged the areas of the world further away from the poles. But this calculation had been necessary to straighten out lines of equal bearing called ‘loxodromes’ in order to enable navigators to plot courses as straight lines on maps.
Mercator’s projection was practical, whilst Peters’ projection was ideological. And though Peters’ projection corrected a discrepancy in the continents’ area, it distorted their shape. The geographer Arthur Robinson likened them to wet laundry hung out to dry.
The Peters controversy highlighted the fact that in order to produce maps, mapmakers need to make choices. The benefit for the study of maps is that those choices reflect the contexts, opinions and feelings of the time, providing fascinating insights.
It is no coincidence that the Earthrise photograph happened to have the Americas as the side of the globe facing the camera. Nor is it accidental that the 1901 Navy League map showed a world at the highpoint of the British Empire in celebratory style for its audience.
The Peters projection arrived in the early 1970s at a time when some were questioning the world on the back of social unrest, nuclear protest, environmental concern and colonial war.
A World Map of People

Arno Peters’ map paled into insignificance against the distortion that computers could apply to the image of the world. After World War II, computers were used to compile and draw maps. Algorithms were able to calculate complex data far quicker and more accurately than humans, and turn them into visual images. The resulting ‘cartograms’ were able to combine spatial data with other types of data such as population figures, health, media or environmental statistics.
Benjamin Hennig’s world map is one such cartogram. To somebody used to the familiar Mercator projection of the map of the world, Hennig’s map is shocking in its level of distortion, with heavily populated regions of China, Japan and India appearing larger. Yet in a sense it is a highly traditional map.
The shipping routes are more-or-less the same as those in the Navy League Map, and Europe retains some prominence in size, and of course, its central placement.
Perhaps the most revolutionary aspect of Hennig’s cartogram is that his world map provides for each and every inhabitant on Earth the same amount of space, regardless of size, status or wealth.
Whether or not that is a reflection of the real world or an aspiration will be up to future historians of cartography to decide.
Originally published by the British Library under the terms of a Creative Commons Attribution 4.0 International license.


