
The first important transformation of English medieval design practice occurred in a military context, during the reign of Henry VIII. Pioneering plans, surveys and designs by leading Tudor engineers are housed in the British Library, particularly within Sir Robert Cotton’s manuscript collection. Anthony Gerbino, Senior Lecturer in Art History at the University of Manchester, explores further.
By Dr. Anthony Gerbino
Senior Lecturer in Art History
University of Manchester
The traditional manner of representing towns was by means of ‘chorography’, typically an elevated view of a settlement in a wider landscape. The term had originated in Ptolemy’s Geographia to distinguish world maps from the representations of specific places and regions. As William Cuningham defined it, chorography ‘sheweth the partes of th’earth, divided in themselves. And severally describeth, the portes, rivers, havens, fluddes, hilles, mountaynes, cities, vaillages, buildings, fortresses, walles, yea and every particular thing, in that parte conteined’. Whereas geography utilised the abstract geometry of the sphere, this science was understood to appeal primarily to the senses: ‘as if a painter shuld set forth the eye, or eare of a man, and not the whole body, so that chorographic consisteth rather in describying the qualitie and figure, then the bignes, and quantitie or any thinge’.[1] Cuningham illustrated the concept with a double-spread engraving of Norwich, ‘as the forme of it is, at this present 1558’, with a legend of the city’s landmarks, principal streets, city gates, and neighbouring villages. It is, in fact, the earliest printed map of an English town.
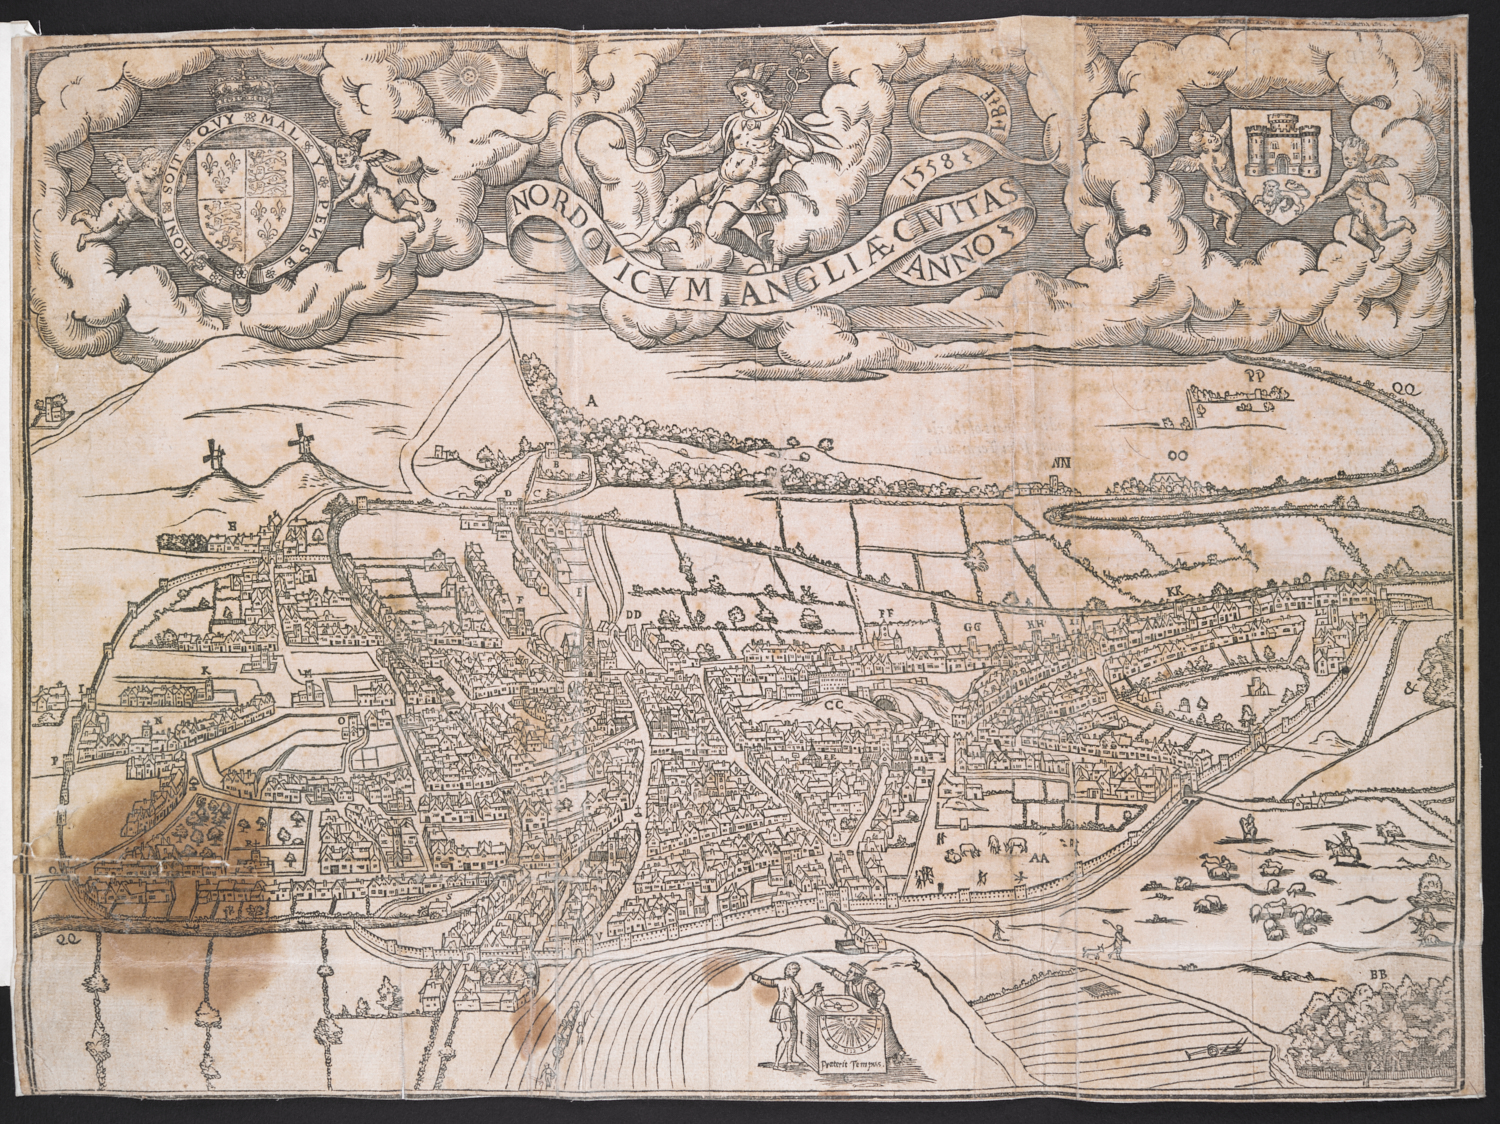
Cuningham’s Cosmographical Glasse is celebrated for its woodcut map of Norwich, which is understood to be the earliest surviving printed map of any English town / British Library, Public Domain
As in this example, chorography might be built up from an initial measured survey – notice the author and his assistant standing over an outsized magnetic compass in the foreground – but, for the most part, this type of pictorial ‘map’ lacked any consistent scale or standardised technique. Such scenes were typically composed by uniting fragmentary views from several different vantage points to form an impressionistic whole.[2]
The scholarship on this subject has focussed on engraved town views of the kind illustrated by Cunningham and compiled in Georg Braun and Franz Hogenberg’s Civitates orbis terrarum (Cologne, 1572-1618). These collections were aimed primarily towards armchair travellers and humanist libraries, but they also appear to have penetrated to the level of the craft practitioner, who began to adapt the form to land surveys and large-scale project drawings from the early sixteenth century. One of the earliest known examples of the type is a bird’s-eye view of fields in the parish of Newnham, Hampshire, made sometime between 1536 and 1551 for a lawsuit concerning the property.

One of the earliest known examples of a hand-drawn bird’s eye view is this drawing of Newnham, Hampshire / The Warden and Scholars of Winchester College
It belongs partly to the tradition of the medieval picture map – the figures and the trees, for example, are far too large relative to the area depicted – but there is also a remarkable coherence to the image, the product of a real attempt to imagine the area from an oblique, elevated position.[3]
An analogous example comes from the early history of Dover harbour. Vincenzo Volpe’s 1532 scheme, commissioned by the town in an attempt to secure government aid, was one of the first of a long line of proposals made for the site through the course of the sixteenth century.
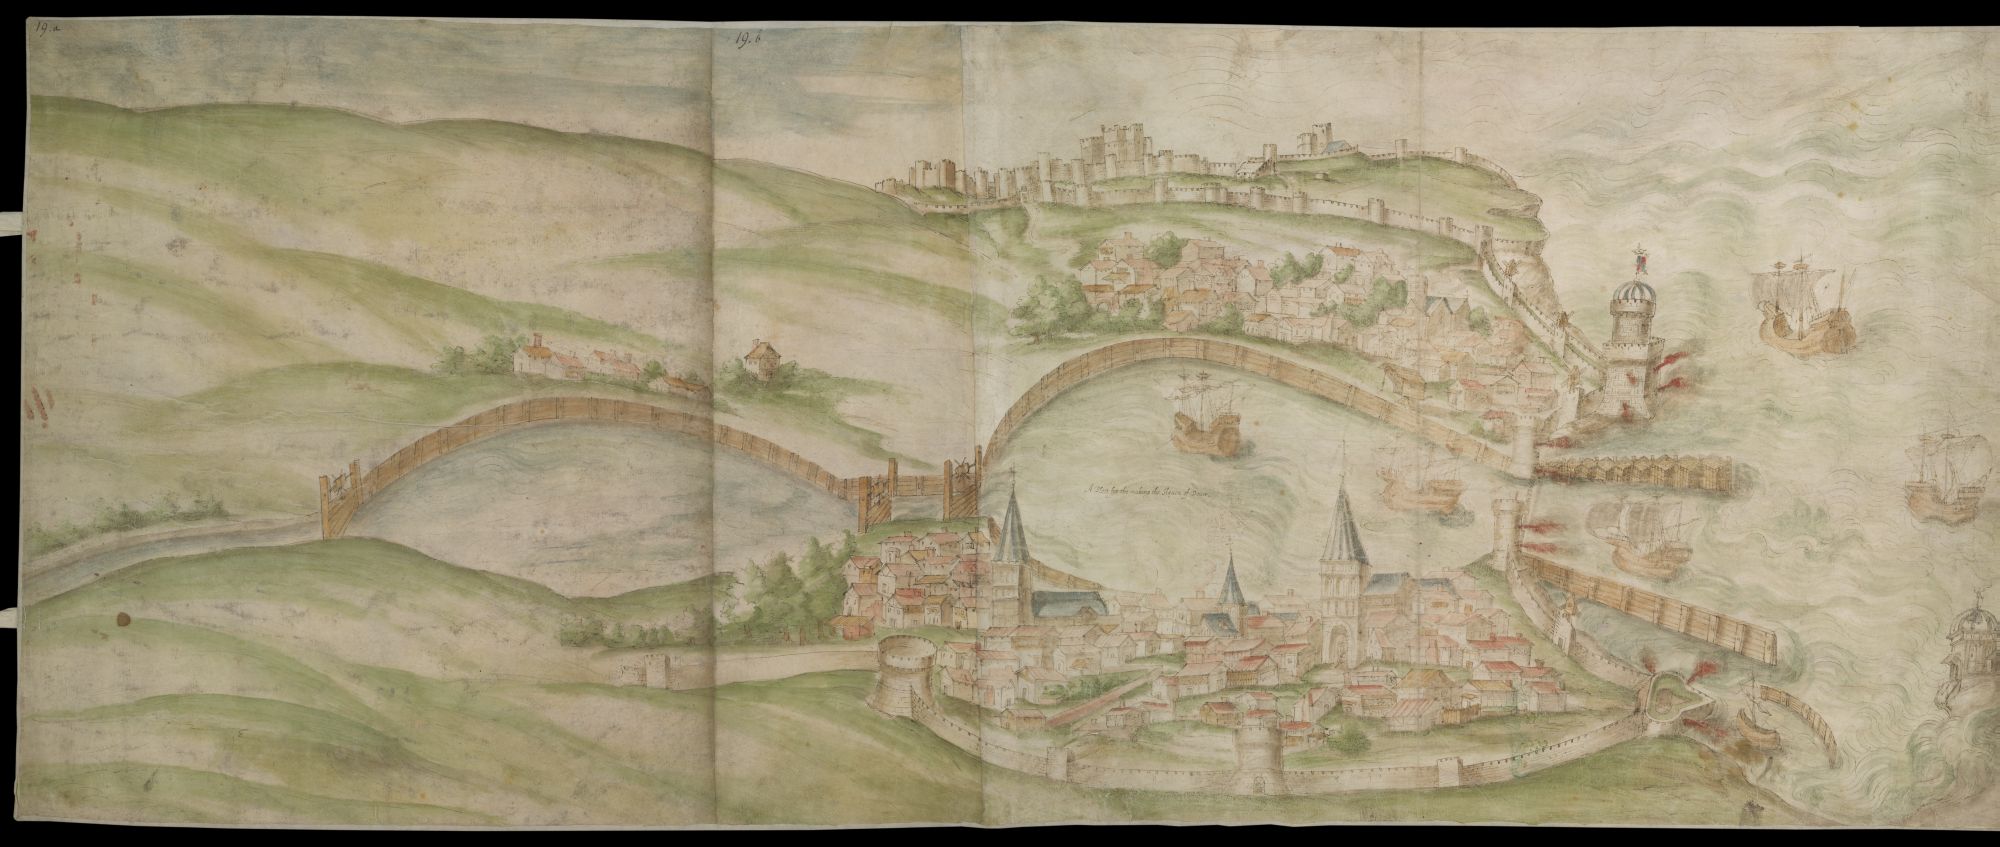
Proposal for a new harbour at Dover: Volpe’s technical drawing contains pictorial flourishes like enlarged church steeples and fortifications / British Library
Volpe’s watercolour envisions two inner harbours dredged from the widened mouth of the Dour, the seaward one shielded by jetties projecting into the bay. The drawing presents a curious mix of pictorial conventions. It is, in the first place, a ‘technical’ drawing for a large-scale engineering work, evidently intended to illustrate the wooden construction of the jetties, shoring, and sluice gates. Yet, the drawing is also conceived as an urban chorography. The visual tropes of the genre – church steeples, the town walls, and the castle in the background – are haphazardly emphasised, to the detriment of any consistent scale. If that were not enough, Volpe has also given the scene the air of a spectacle, adding ships sailing into the harbour and cannons sounding out from fortified towers. The image was, after all, intended for the king’s eyes.[4]
One might expect such a pictorial showpiece from Henry’s court painter. It is more surprising to find one from the hand of a royal mason and fortification engineer. A beautiful view of Calais harbour (about 1541) has been attributed to Richard Lee, Surveyor of the Works in the Calais Pale.

Proposed new gun towers are seen in this view of Calais, attributed to Henry VIII’s Surveyor, Richard Lee / British Library
The drawing is one of two of the site by the same hand. Both are related to fortification projects initiated in 1539, following Henry’s excommunication and the ensuing alarm over a potential Catholic alliance against England. The drawing shows a proposal for two new gun towers on the cliffs east of the city, defending the approach from the sea. In view of its practical purpose, it includes most of the necessary information for the king and his council to make a decision, including the towers’ relative proximity to Calais, the length of the wooden jetties at the mouth of the harbour, and the outline of navigable sea lanes, marked out with pink wash. Yet what stands out for modern eyes is that the proposal has been conceived pictorially. It is, in essence, a highly competent landscape, enlivened with picturesque flourishes, such as the red roofs of the houses in Calais and the vertical hatching of the cliffs on the shoreline. Even more than Volpe, the artist took particular delight in representing ships, which are drawn in exquisite detail.[5]
For all their visual charm, chorographic views necessarily lacked precision, particularly regarding distances. Without the help of an interpreter with first-hand knowledge of the site, this handicap could present series obstacles for decision-makers. This was especially true for fortifications, which were largely determined by lines of fire and the range of cannons. These circumstances must partly explain the appearance of the first English-made scale plans and geometrical surveys.
Although scale maps of towns and large engineering projects had been used in Italy since the end of the fifteenth century, the technique remained virtually unknown in England. The earliest surviving examples occur in a group of four plans or ‘plats’ probably made in early 1541 by Richard Lee and the mason-engineer John Rogers at Guines, another of the English strongholds in the Pale of Calais. A preparatory survey of the existing walls and moat of the town can be considered the first of the series.
There are two unusual features of the plan that suggest that the concept of scale was new to the draughtsman or to his audience: a continuous graded ruler ringing the entire town and an inscription that records the scale in a roundabout way: ‘the Inshe conteynyth L fotte’. Although it has none of the visual interest of a bird’s-eye view, the plan represents a great conceptual and technical leap. Rather than mimicking the impression of an observing subject, it represents abstractly and indirectly the totality of physically measurements of the site, in a way that can be experienced by no single individual. Here, scale allows the drawing to become not simply an imagined ‘view’ of the proposed works but a mathematical instrument for both its planning and its realisation. A contemporary drawing of the same site, attributed to a Portuguese engineer in the King’s service, illustrates how novel the technique must have seemed.[6]
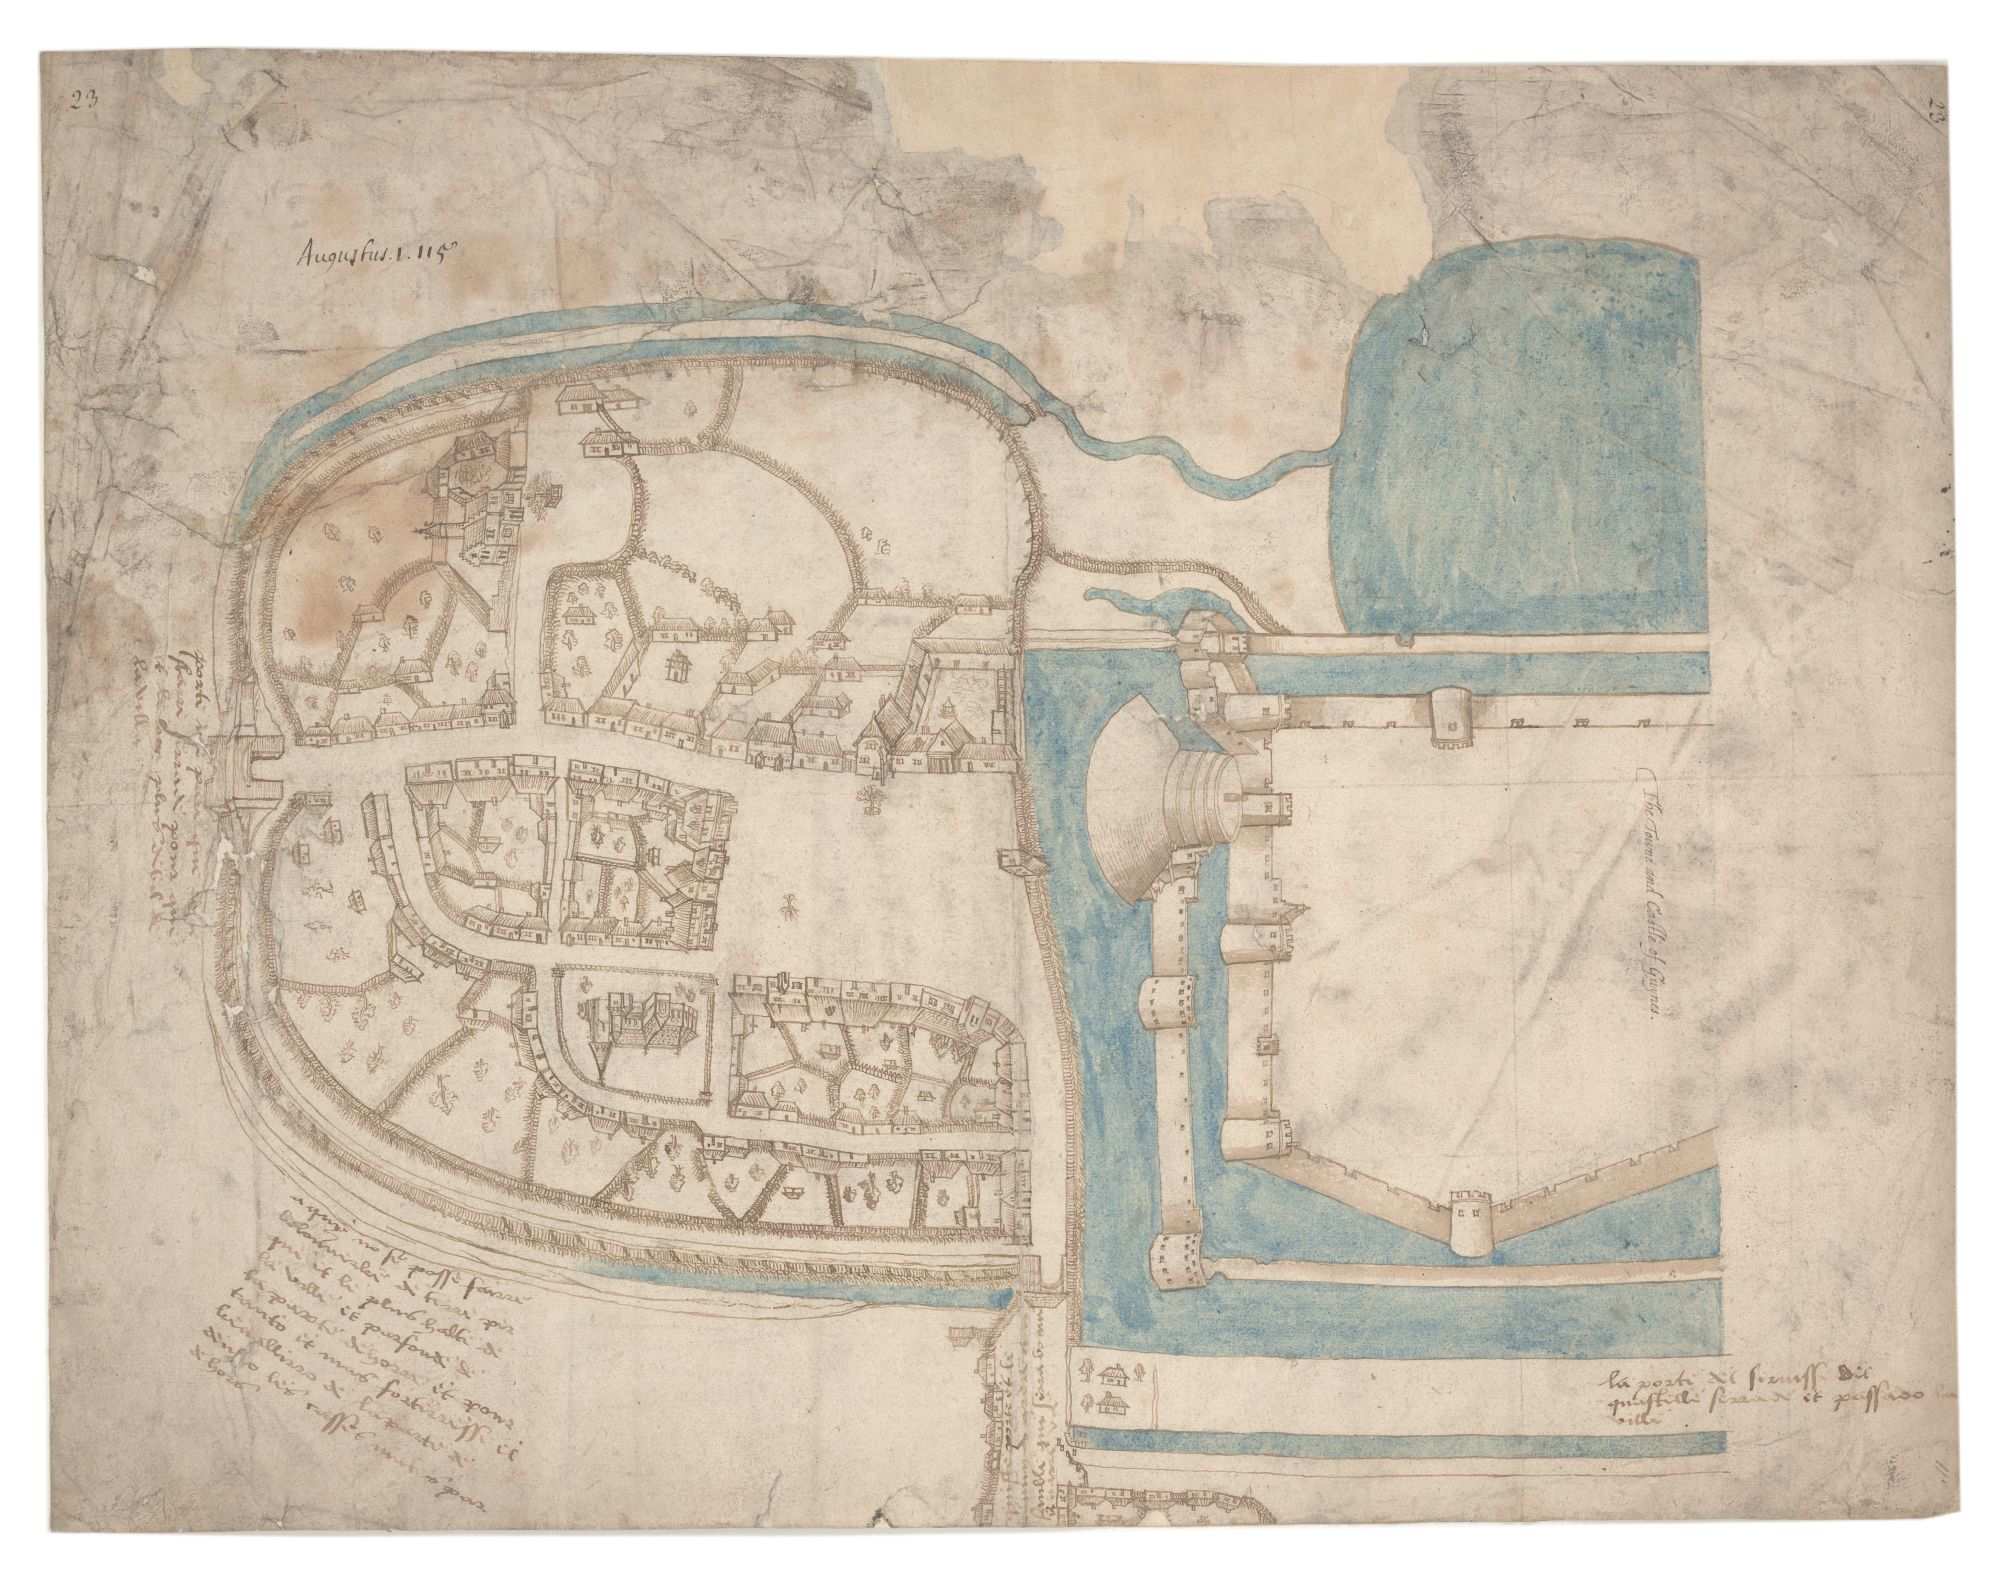
Plan of the town and castle of Guines: In this engineer’s drawing of Guines, buildings and fortifications are drawn in slight relief to give an impression of elevation / British Library
This contrast is deliberately employed in another plan by Rogers, a magnificent presentation drawing for new defensive works at Hull, Yorkshire.
Completed in October 1541, it is linked to his work at Guines as part of the same nationwide scheme of fortification, in this case to defend against a possible incursion by the Scots, newly allied with the French. Over six feet long, the drawing shows three proposed bulwarks or ‘blockhouses’ east of the town, connected by a fortified wall almost 2,500 feet in length. The entire complex was to run along the river, opposite the town. This drawing and two others for the same project happen to be the earliest known scale plans for architectural works in England, but the document’s interest goes beyond this fact of chronology. Even at this incipient stage, Rogers had adapted the technique to a rhetorical purpose, not only by drawing the plan to such a large size, but also by contrasting it with the small houses across the river. Roughly sketched in bird’s-eye view, these are even embellished with charming touches, including gabled roofs, little doors, windows, and puffs of smoke from the chimneys. The plan of the bulwarks, on the other hand, is drafted in delicate, precise ruled lines. The contrasting styles call attention to the project’s massiveness, to its defensive strength, and – not least – to the meticulousness of its planning.[7]
The scale of these drawings approaches that of local maps and city plans, so it is perhaps not surprising to find Henry’s programme leading to innovations in that area also. The famous Portsmouth Map of 1545 is the first ‘ichnographic’ plan of an entire English town, in which all of the topographical features – from the proposed fortifications to small dwellings – are represented in plan or to scale.
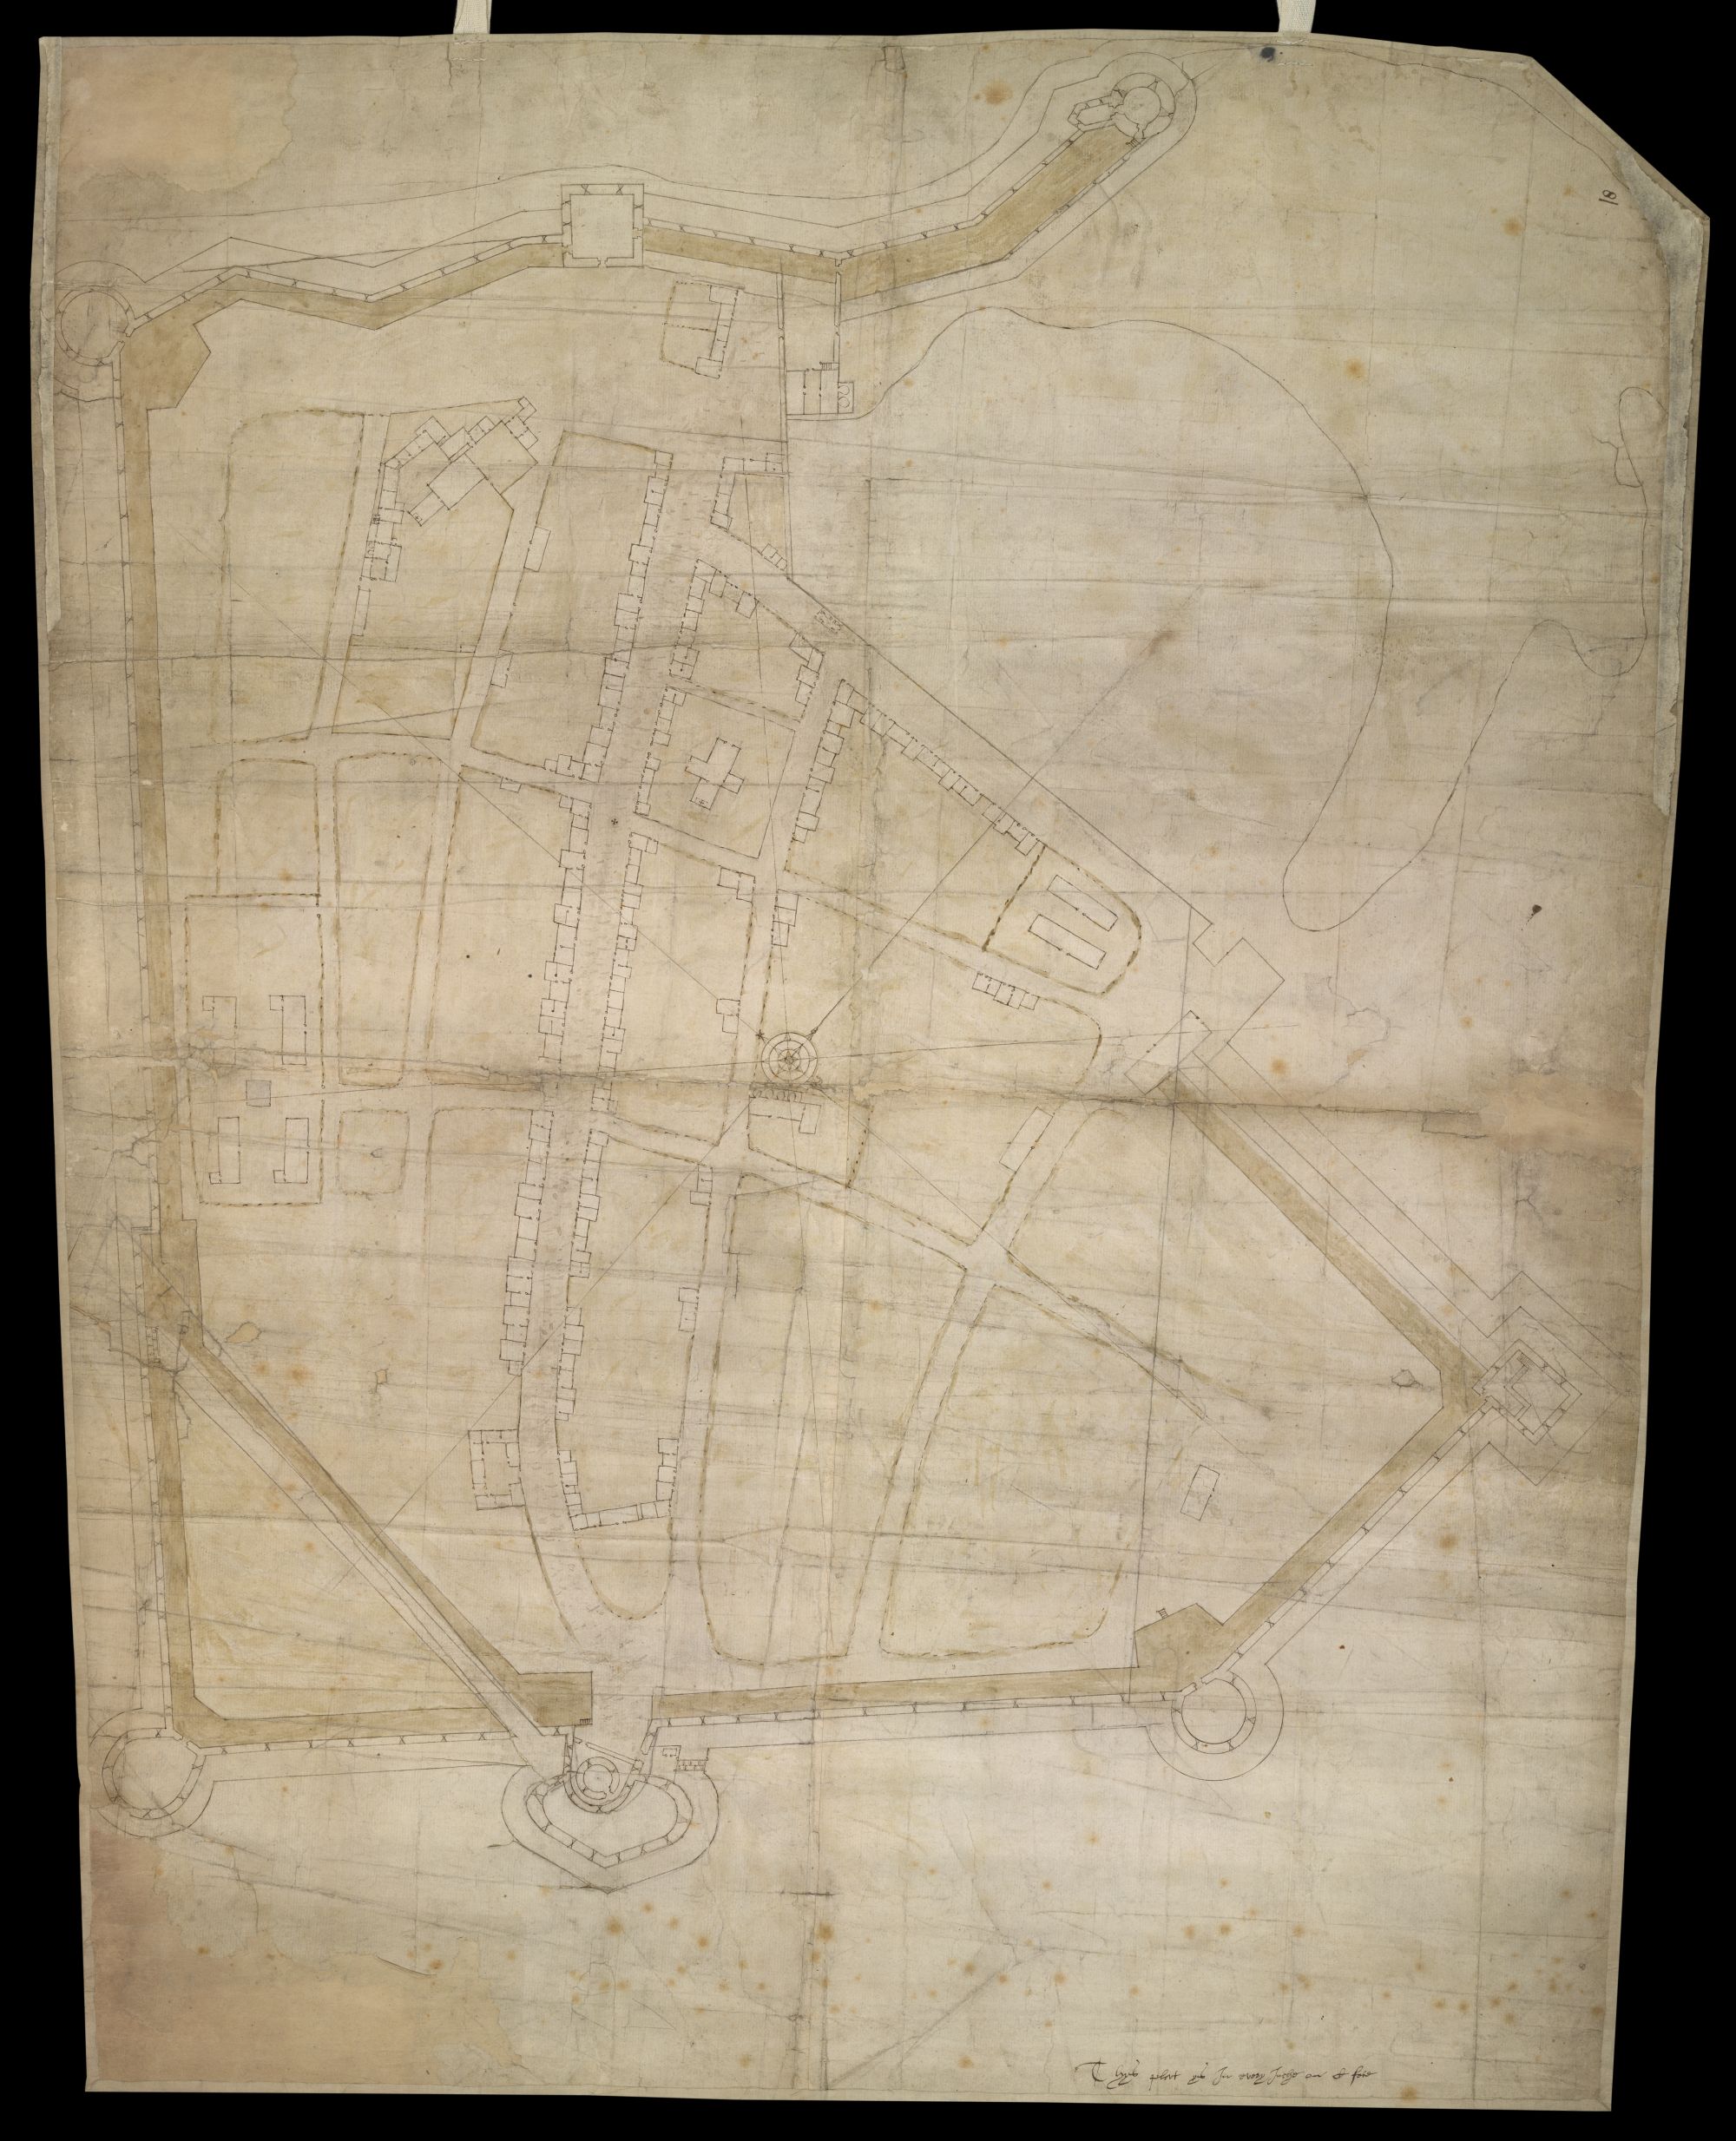
Plan of the fortifications of the town of Portsmouth: This is the earliest known map of a British town to be drawn to scale / British Library
Indeed, the absence of any pictorial imagery or out-of-scale elements is striking. In this respect, the map reflects the geometrical procedures used to make it. The basic technique was to make a measured transit around the town walls, recording changes in orientation with a magnetic compass. For greater accuracy, the map-maker would then have correlated the results with a second set of readings, made by plotting topographical features from a fixed point, using a radial sighting instrument. The wind rose in the centre of the drawing may represent this process. The cartographic conventions used here have become so ubiquitous that it is difficult to appreciate the plan’s originality. In fact, maps of this kind were rare even in Italy. Other than Leonardo da Vinci’s plan of Imola in 1502 – the earliest known instance – few examples survive from anywhere in Europe before the middle of the sixteenth century.[8]
The plan’s authorship is unknown, although Richard Lee may have had a hand in it. He had been placed in charge of the town and its fortifications on 26 July 1545, following the events of 19 June, in which a French attack and landing on the Isle of Wight drew attention to the weakness of the local defences. The plan constitutes a response to this incident, combining a survey of the existing walls with a proposed improvement. The principal recommendation is shown in the walled area in the north-eastern part of the town, which is cut off by a transverse ditch and earthen rampart commanded by the great pointed ‘bastillion’ at the end of the high street. The proposal is noteworthy because it introduces concepts of modern Italian engineering into what was essentially a medieval defensive system of high walls and tall, salient towers. There are, in fact, further alterations, sketched out in pencil, that develop this strategy. Two Italianate angle bastions have been added to support the great ‘bastillion’, one at the point where the south-east wall joins the traverse and another immediately adjacent to the round tower north of the town. To this latter element is attached a ruled line indicating another transverse rampart leading toward the harbour and further reducing the defensive circuit. Additional pencil marks show how the flankers located in the neck of the ‘bastillion’ might be adapted to rake the ditches on either side. Although the alterations were not carried out their presence is nonetheless remarkable. As Martin Biddle has argued, the amended scheme is the earliest known plan for the defence of an English town by means of a fully flanked, bastioned system. In a more general sense, the pencilled additions illustrate the crucial mediating role that paper plans had come to fill among engineers and decision-makers. This was clearly a working document, which appears to have been the object of considerable discussion.
As an urban map, the Portsmouth plan also stands out for its scale – ‘Thys plat ys In every Inche on C fote’ – which is far smaller (as a ratio) than that of most sixteenth-century architectural drawings. In this respect, the plan fits within a broader shift in the history of English cartography toward the first large measured surveys. John Rogers was also at the forefront of this development, as in so many other advances in technical drawing. Among his plans for the defences at Hull, for example, is a map of the countryside around the town, showing settlements on both sides of the Humber, as well as roads, landmarks, and watercourses. Along with two drawings that he made of the area around Boulogne in 1546, they are the first English-made local maps to include scale bars. As a group, they were made for a single purpose, namely to situate large fortification projects in a topographical context. This circumstance is surely significant, for it suggests that the kind of strategic planning involved in fortification design lent itself not only to the use of scale plans but also – and almost immediately – to scale mapping. In this respect, the second Boulogne drawing is characteristic, for it shows an elaborate scheme of English counter-fortification in view of a potential attack on the French-held forts opposite the river Liane.[9]
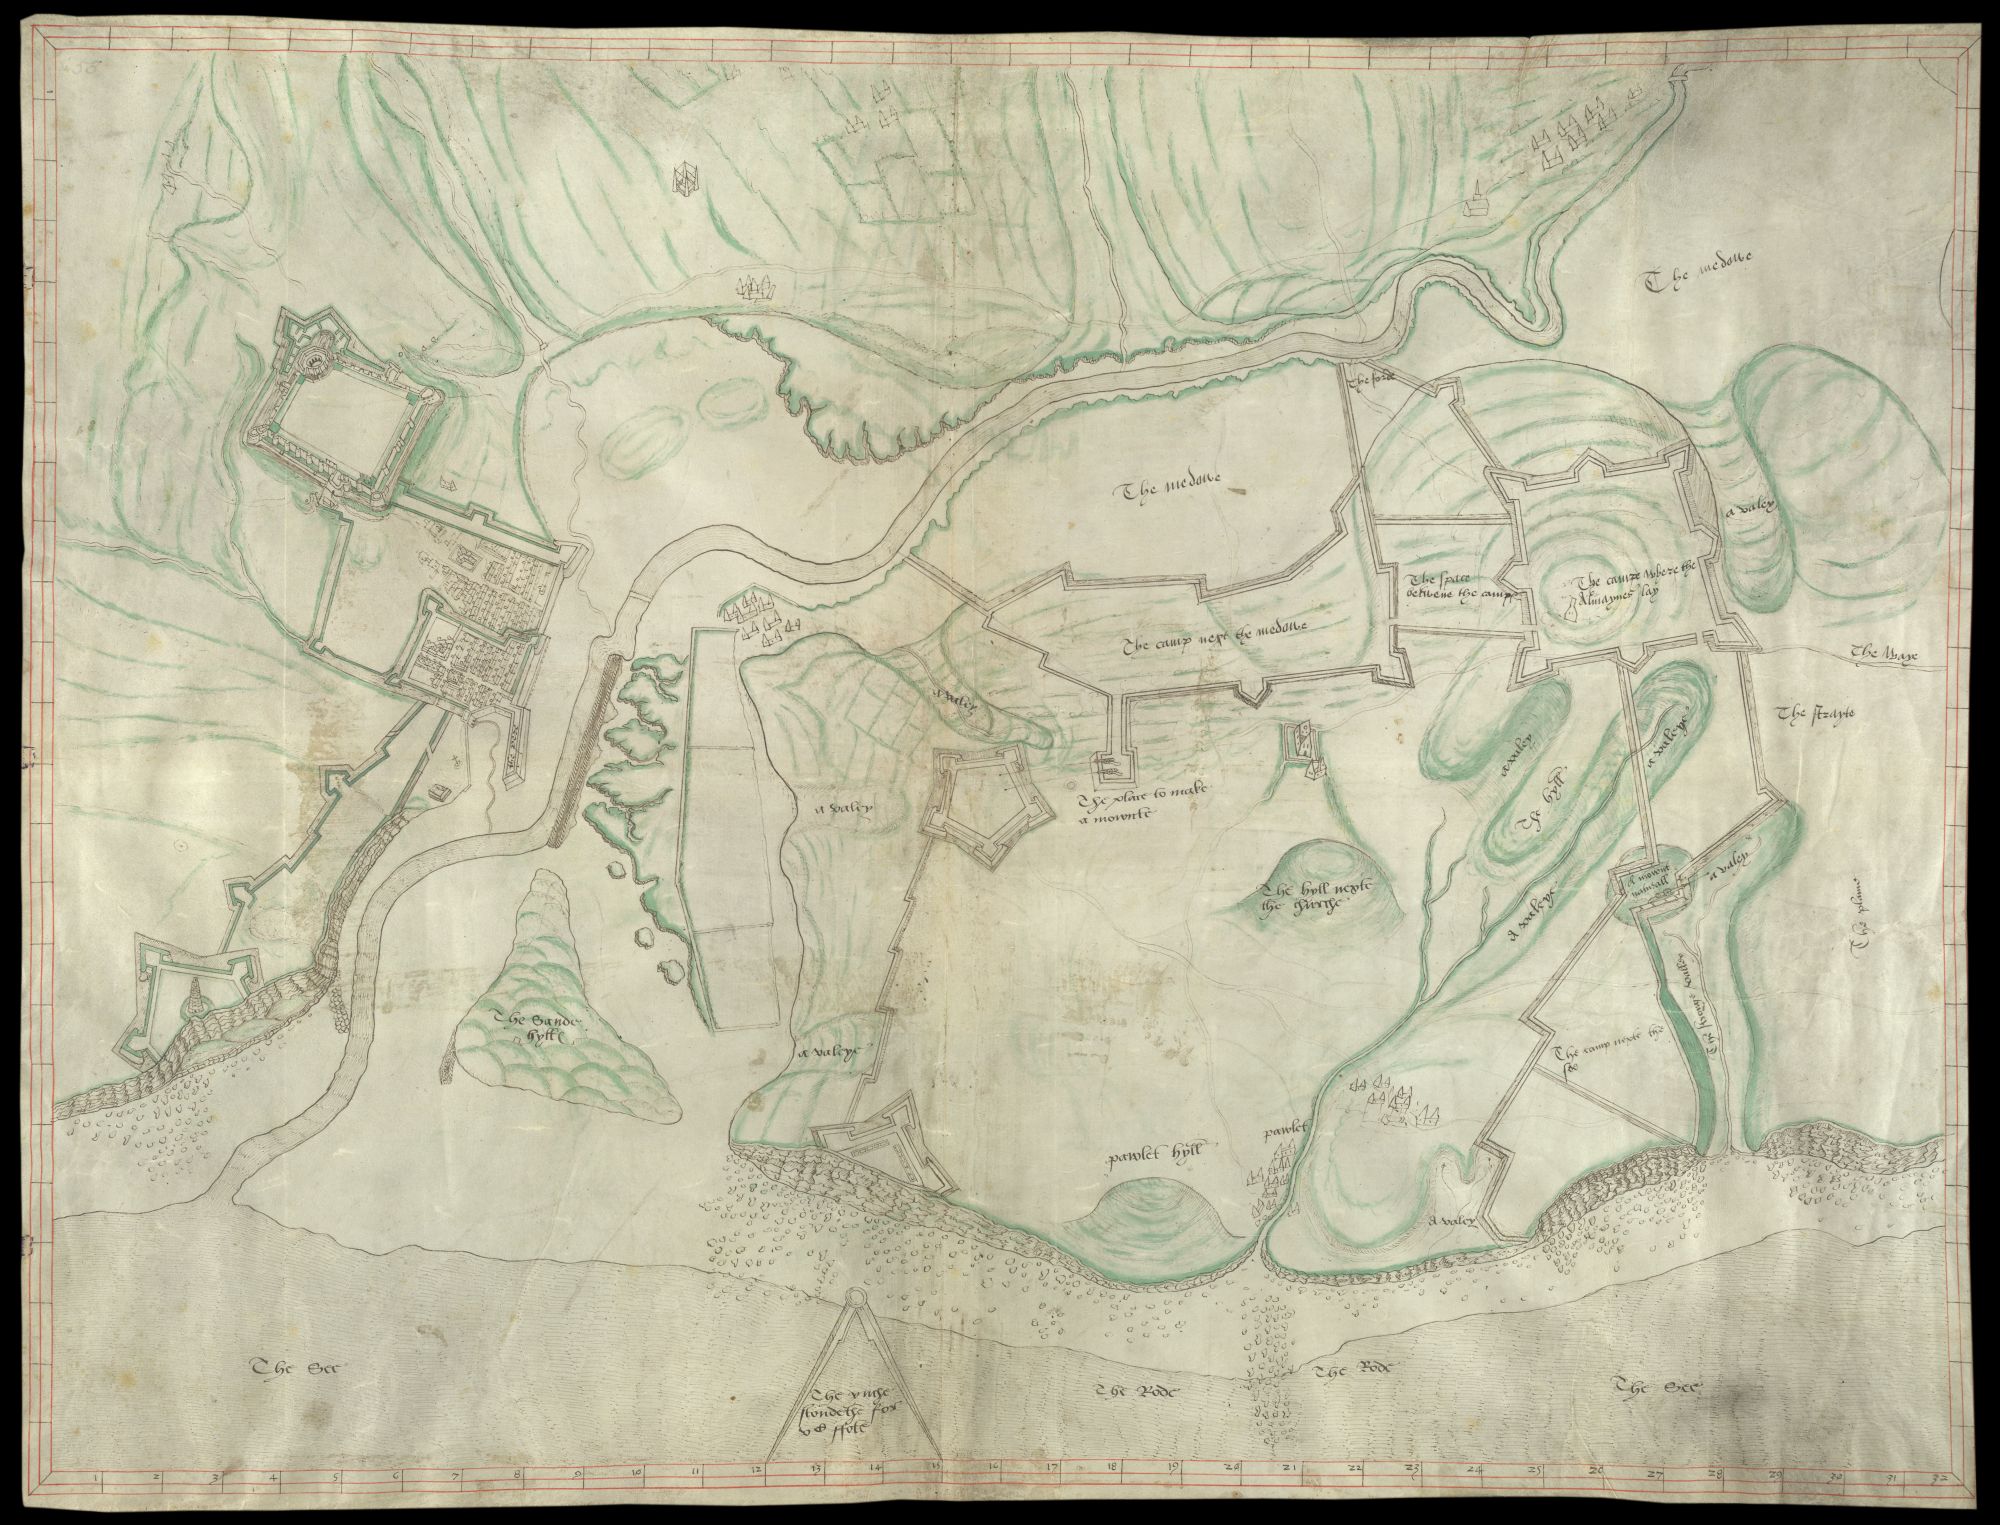
This plan of Boulogne shows the counter-fortifications Henry VIII installed against French attack / British Library
This shift must have initially imposed itself as a matter of military necessity, but the advantages of scale maps for other situations were quickly recognised. The first measured estate plans from the 1570s and 1580s, for example, are the direct descendants of the drawings produced by Henry VIII’s engineers. To be sure, the chorographic tradition persisted for a long time. Pictorial imagery continued to be used for maps as well as for large building works well into the seventeenth century. But the benefits of scale plans would prove increasingly compelling. In time, the technique would become a habit of thought so ingrained as to seem almost natural.[10]
Rogers himself appears to have appreciated the wider benefits of scale drawing almost immediately. During his time at Hull in 1542-43, he was assigned to remodel the interior of Hull Manor for use as a royal residence and administrative seat. Among the drawings that he produced for this commission are the earliest scale plans we have for a civic building in England.

Henry VIII acquired Hull Manor as a royal residence and keep in 1539, and John Rogers was commissioned to alter it for the king’s use soon after / British Library
The engineer accompanied these plans with a large, bird’s-eye view of the same house, probably intended as a presentation drawing to inform the king of the building’s general situation.

This bird’s-eye perspective of Hull Manor House shows several improvements planned for the royal property / British Library
The contrast between the plans and the view is instructive, not because of the inconsistencies in perspective – which might be expected from a mason – but because the proportions of the layout have been purposely distorted. The wings drawn as diagonals – including the great hall separating the two courtyards – have been lengthened in relation to those before and behind. These elements were presumably altered to make the courtyard elevations more legible, but it is nevertheless striking that Rogers could depart so casually from the scale plan. He evidently did not expect the discrepancy to confuse his patrons, or, indeed, to matter much to them.[11]
Scale building plans are attested from pre-classical times, but they do not appear to have been a tool for medieval building practice in England. One might point to the fact that none are extant from before 1540, but the nature and character of the earliest survivors is also telling. These first surviving scale plans emerged from situations where the need to portray conditions on the ground accurately, to maintain consistent proportional relationships in the layout of defences, and to provide controlling authoritative design became – or were perceived as– a matter of life and death. The fact that fortresses were generally too large to be designed on site may also have contributed to the adoption and spread of the technique. The simultaneous appearance of local maps drawn to scale provides further evidence of this phenomenon. P.D.A. Harvey has counted about forty existing measured surveys datable from 1540 to 1550, nearly all of them of town walls or castles, and probably all produced by military engineers.[12]
There remains one problem with this story, which historians have so far not been able to solve. How exactly did Lee and Rogers learn the use of scale drawing? It was long believed that they picked it up from itinerant Italian engineers. As Marcus Merriman has shown, there were several such men in the king’s service. Yet, a possible point of contact is elusive. No Italian engineers, as far as we know, served at Guines, Calais, or Hull. More surprisingly, few of the existing plans from other sites that we can confidently attribute to an Italian author are drawn to scale. Of course, it is possible that English engineers discovered the technique themselves, as they grappled with the novel design problems involved in defending against cannon fire. Rogers had, after all, trained as a mason, and Lee’s family also appears to have been connected to the craft. With such a background, it would have been a straightforward step to transfer the basic idea of scale from elevations and working drawings – which were common enough – to plans. Accurate surveying of towns and countryside was a trickier problem, but these tasks, too, would probably have drawn on a mason’s normal training in land measuring. The duties of the craft often overlapped with those of the estate surveyor.
Whatever route Lee and Rogers took, the underlying cause of this shift remains the same. These men came from traditional craft backgrounds, but the crucible or war fundamentally altered their professional culture. New design challenges played a part, as did the demands of building at an unprecedented scale and with exceptional urgency. Moreover, the royal engineers were often thrown together not only with foreign engineers but also with practitioners in other crafts – from pilots to cartographers to gunners. All of these factors gave Henry’s engineers a level of practical mathematical expertise that would have been very unusual amongst most civil builders.
This text is an edited version of ‘The Paper Revolution: The Origin of Large-Scale Technical Drawing under Henry VIII’, chapter two of Anthony Gerbino and Stephen Johnston, Compass & Rule: Architecture as Mathematical Practice in England (New Haven and London: Yale University Press, 2009), pp. 31-44.
Notes
- William Cuningham, The Cosmographical Glasse (London: John Day, 1559), pp. 6-7.
- See Juergen Schulz, ‘Jacopo de’Barbari’s View of Venice: Map Making, City Views, and Moralized Geography before the Year 1500’, Art Bulletin, 60, no.3 (1978), pp. 425-474; Thomas Frangenberg, ‘Chorographies of Florence: The Use of City Views and City Plans in the Sixteenth Century’, Imago Mundi, 46 (1994), pp. 41-64; Lucia Nuti, ‘The Perspective Plan in the Sixteenth Century: The Invention of a Representational Language’, Art Bulletin, 76, no.1 (1994), pp. 105-128; and David Friedman, ‘“Fiorenza”: Geography and Representation in a Fifteenth-century City View’, Zeitschrift für Kunstgeschichte, 64, no.1 (2001), pp. 65-77.
- Winchester College Muniments, no.3233. Published and discussed by John Harvey, ‘Early Tudor Draughtsmen’, in The Connoisseur Coronation Book, ed. L.G.G. Ramsey (London: Connoisseur, 1953), pp. 97-102.
- British Library, Cotton MS Augustus I i 19. See Martin Biddle and John Summerson, ‘Dover Harbour’ in H.M. Colvin, The History of the King’s Works, (London: 1963), iv, pp. 729-768, esp. p. 732, fn.4. On other drawings for Dover, see William Minet, ‘Some Unpublished Plans of Dover Harbour’, Archaeologia, 62 (1992), pp. 185-225 and A. Macdonald, ‘Plans of Dover in the Sixteenth Century’, Archaeologia Cantiana, 49 (1937), pp. 108-126.
- See H.M. Colvin, ‘Calais’, in The History of the King’s Works, I, pp. 423-456, esp. p. 444; iii, pp. 337-374, esp. pp. 354-355. The gun towers were never executed. On the dating and attribution of this drawing, see Anthony Gerbino and Stephen Johnston, Compass & Rule: Architecture as Mathematical Practice in England (New Haven and London: Yale University Press, 2009), pp. 174-5, cat.no.10.
- Both plans are held in the British Library: Cotton MS Augustus I Supplement 14 (attributed to Lee and Rogers) and Cotton MS Augustus I ii 23 (anonymous Portuguese engineer). See Lonnie Royce Shelby, John Rogers: Tudor Military Engineer (Oxford: Clarendon Press, 1967), pp. 5-23; P.D.A. Harvey, ‘The Portsmouth Map of 1545 and the Introduction of Scale Maps into England’, in John Webb, Nigel Yates, and Sarah Peacock, eds., Hampshire Studies (Portsmouth City Record Office, 1981), pp. 33-49; and P.D.A. Harvey, Maps in Tudor England (London: Public Record Office and the British Library, 1993), pp. 31, 36. On the appearance of urban surveying in Italy, see Hilary Ballon and David Friedman, ‘Portraying the City in Early Modern Europe: Measurement, Representation, and Planning’, in J.B. Harley and David Woodward, eds., The History of Cartography, 3 vols (Chicago: University of Chicago Press, 1987-2007), iii, pt. I, p. 680.
- Shelby, John Rogers, pp. 24-35, and Harvey, Maps in Tudor England, pp. 31, 40. The fortresses were completed by December 1543 and destroyed in the nineteenth century. See Colvin, ‘Hull, Yorkshire’, in The History of the King’s Works, iv, pp. 472-477.
- See Harvey, ‘The Portsmouth Map of 1545’; Martin Biddle and John Summerson, ‘Portsmouth and the Isle of Wight’, in Colvin, The History of the King’s Works, iv, pp. 488-568, esp. pp. 503-506; Harvey, Maps in Tudor England, pp. 69, 72-73; and Ballon and Friedman, ‘Portraying the City’.
- For Hull: British Library, Cotton MS Augustus I Supplement 20. For Boulogne: Cotton MS Augustus I ii 77 and I ii 53. See Shelby, John Rogers, pp. 33-34, 98-103. On military surveying generally, see R.A. Skelton, ‘The Military Surveyor’s Contribution to Cartography in the 16th Century’, Imago Mundi, 24 (1970), pp. 77-83.
- On estate surveys, see E.G.R. Taylor, ‘The Surveyor’, Economic History Review, 17, no.2 (1947), pp. 122-133; and P.D.A. Harvey, ‘Estate Surveyors and the Spread of the Scape-map in England 1550-80’, Landscape History, 15 (1993), pp. 37-49. On earlier mapping conventions, see Derek J. Price, ‘Medieval Land Surveying and Topographical Maps’, Geographical Journal, 121, no.1 (1995), pp. 1-7. For a useful overview, see Peter Barber, ‘England I’ and ‘England II’, in David Buisseret, ed., Monarchs, Ministers, and Maps: The Emergence of Cartography as a Tool of Government in Early Modern Europe (Chicago: University of Chicago Press, 1992), pp. 26-56, 57-98.
- On both drawings, see Shelby, John Rogers, pp. 34-46.
- Harvey, ‘The Portsmouth Map of 1545’, 37. On the earliest scale plans, see P.D.A. Harvey, The History of Topographical Maps: Symbols, Pictures and Surveys (London: Thames and Hudson, 1980), pp. 122-32.
Originally published by the British Library under a Creative Commons Attribution 4.0 International license.