Maps have shaped American cultural ideas about travel, place, and ownership.
Introduction
From the earliest days of settlement and migration, the people of North America have relied on maps and mapping to understand their environment and place within it. Maps have helped Americans prospect investments, comprehend war, and plan leisure in places unknown. As Americans have used maps to explore the U.S., capitalize on its resources, and displace its Native peoples, maps have shaped American cultural ideas about travel, place, and ownership.
This exhibit explores the cultural and historic impact of mapping through four specific moments in American history: migration along the Oregon Trail, the rise of the lumber industry, the Civil War, and the popularization of the automobile and individual tourism. It concludes with a look at maps in the age of computers, the Internet, and beyond. These moments demonstrate the influence maps have had over how Americans imagine, exploit, and interact with national geographies and local places.
Westward Expansion
Overview
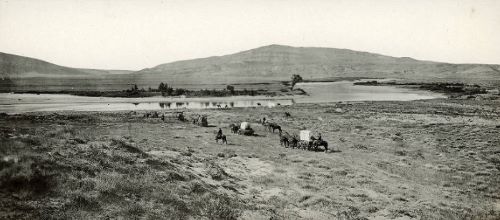
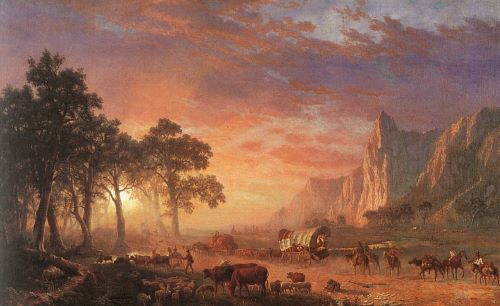
What began as an informal network of trails created by Native Americans to trade and hunt was expanded by the expeditions of prominent explorers, including Meriwether Lewis, William Clark, and John Jacob Astor to become the migration paths of America’s settlers and later some of the roads and highways that traverse the country today. Early traders, mapmakers, and surveyors provided descriptions and rudimentary maps to people living in the East that piqued the public imagination. Fur traders, such as Jedediah Smith and Kit Carson, later expanded American settlers’ knowledge of the Western half of the continent by sharing experiences from their trapping expeditions. Missionaries used this information to venture into the northwest to found churches in the 1830s. Large-scale migration into the Oregon Territory began in 1840, when the trail, which would become known as the “Oregon Trail,” was still faint and maps were scarce.
Heading West
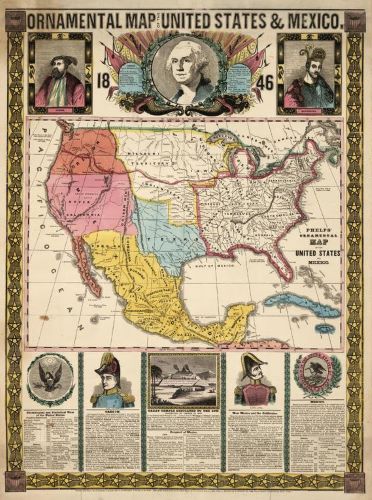
Settlers heading west in the early part of the nineteenth century were advised to keep their wagonloads light, so heavy atlases were left at home, with guidebooks and newspaper articles often serving as substitutes. Detailed maps such as the Ornamental Map of the United States and Mexico or Johnson’s Family Atlas served more to inspire settlers westward than as actual navigational tools. Rather, wagon parties often hired experienced guides, sometimes former fur trappers, who knew the journey well and could help them make the crossing. The first major wagon train of this nature departed from St. Louis in 1843, under the direction of John Gantt, and contained between 700 and 1,000 emigrants.
John C. Fremont, a military officer and explorer heralded by the press of his day as “The Pathfinder,” undertook several westward expeditions in the 1840s to survey and create maps of the western United States. His first expedition began in 1842 and was succeeded in the following year by a more rigorous expedition with a crew of surveyors and cartographers. This expedition, along with two subsequent forays, provided a wealth of details about what is now known as the Oregon Trail.
The Oregon Trail: Challenges and Conflict
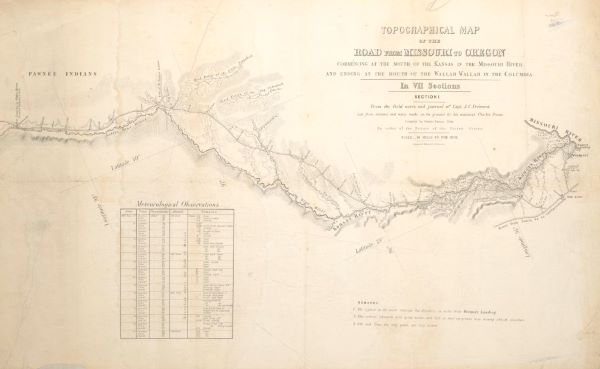
Between 1840 and the 1890s, an estimated 400,000 people used the 2,200-mile Oregon Trail. As use increased, the need for experienced guides declined with the rise of accurate maps and no less important, the well-worn wagon-wheel ruts that new travelers could use to make their way west.
John C. Fremont’s efforts to map the Trail also identified key locations of native populations along the route, including major tribes such as the Cheyenne and the Pawnee. Like other settlements in American history, the push westward brought Anglo migrants and native populations into contact through business and trade, often causing tensions between migrant visions of prosperity and the Native’s own values and beliefs. By the mid-nineteenth century, a number of these encounters led to violence.
Like the Bear River Massacre, the 1854 Grattan Massacre of the Lakota Sioux by the U.S. Army occurred in Nebraska Territory, just one of the many Western regions still being explored, understood, and adequately mapped by white settlers. These conflicts received attention from journalists in the East and demonstrated to travelers the types of challenges they might face along the trail were not only geographical in nature.
Many Paths West
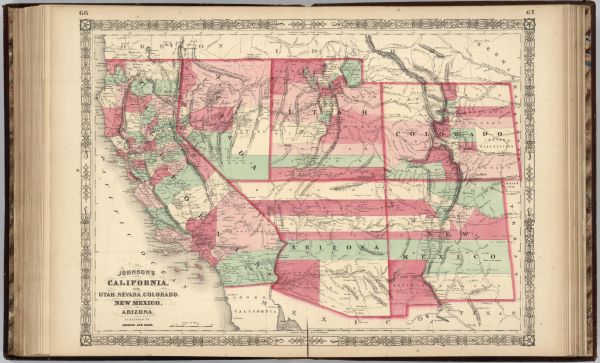
The Oregon Territory was not the only destination for settlers in the mid-nineteenth century. Mormon settlers emigrated to Utah beginning in 1847 to escape religious persecution. Their route and destination were inspired in part by John C. Fremont’s maps published earlier in the decade. Between 1847 and 1860, over 43,000 Mormon settlers followed what is now known as the Mormon Trail into Utah.
In 1848, gold found in California’s American River sparked frenzy, prompting thousands to rush to California to seek their fortune. Maps played a valuable role in directing emigrants to their prospects in the West. The ”49ers” crossed through portions of the Oregon Trail, coupled with a route discovered by Kit Carson into the American River Valley. Other settlers followed the Truckee Route into the Sacramento Valley. Once they made it to California, regional maps provided more specific information about (and often marketed) “desirable” locations. Towns sprouted up along routes heading west and within the new western territories. Many modern roads would be paved along the same routes traveled by settlers in the nineteenth century and the native peoples who first walked them centuries before.
The Rise and Fall of America’s Forests
Overview
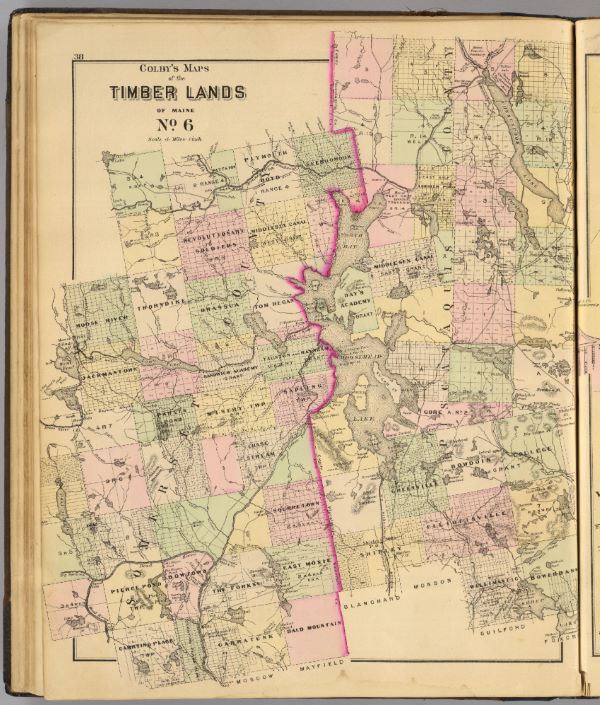
The end of the Revolutionary War in 1783 marked the beginning of a new era. American colonists, having proved their strength against England, were determined to expand and increase their national wealth. As part of their push west, business prospectors and investors began to explore the American continent with an eye towards harnessing its natural treasures. The landscape, virtually overflowing with wild animals, mines and mineral deposits, countless fresh water bodies, vast expanses of forests, and potential farmland, was quickly surveyed and mapped. Investors saw these natural resources as theirs for the taking, ready to be seized, developed, and exploited for profit.
American life was literally built on timber. Its utility—for construction, heating, furniture, tools, and other everyday contrivances—made it particularly attractive to investors as the West opened up in the nineteenth century. Maps of the era reveal this fixation on identifying timber-rich lands that could be logged to fill the ever-growing need for wood by the rapidly multiplying American states.
The acquisition of land that would become the United States (including the Louisiana Purchase), along with the settler population’s increasing comfort with the continent’s geography and native populations, opened up vast tracts of land previously unimaginable to lumber companies and their employees. From the lakes region in Minnesota and the Upper Midwest, to the frontier in the Mountain West, lumber appeared limitless. Settlers saw large forests as even larger dollar signs, and, like other natural resources, maps were created to show investors where their money was going and from whence their profits came.
The presence of lumberyards in major towns throughout the country indicated the widespread domestic need for wood. Local use was not the end of the story however. By the early-twentieth century, the U.S. lumber exports were supplying large markets throughout the western world, in large part due to careful mapping, burgeoning financial investment, and the growth of national infrastructure.
New Visions of Ownership: Maps and Native Americans
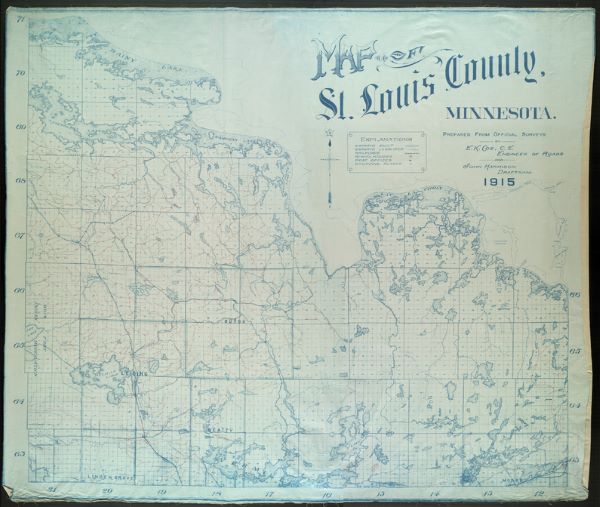
Throughout North America’s early history, native peoples lived in some of the largest and most desirable forests on the continent. The Indian Appropriations Act of 1851 forced Native American populations onto reservations, in effect changing American geography. The tribes’ ecological and spiritual relationships with the land, including its forests, often made them protective and territorial in the face of industrial pressures. Maps once depicted large American regions with a general identification of native populations. Once tribes were relocated to very specific areas, their resources were suddenly available to industrialists, and maps evolved to cover the locations and boundaries of the newly depopulated lands as well as reservations. The mapping of reservations, along with built infrastructure like railroads, became, in effect, an act of “taming” the American landscape during the late nineteenth and early twentieth centuries.
Lumber, Railroads, and Migration
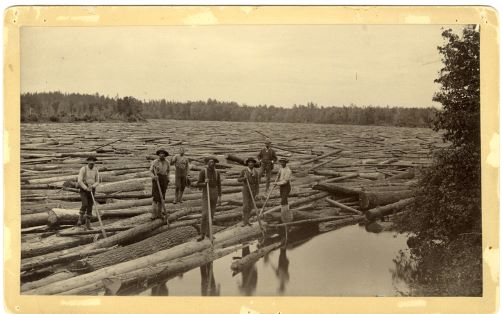
By the turn of the twentieth century, the American railway system extended across the entire continent. Maps visualizing the lines of the Northwestern Pacific Railroad and the North Pacific Railway showcased timber-laden regions as both economic and natural wonders. Similar to the dusty miners of the gold rush, migrant workers took to the West, riding the railroad across the country, where they hoped to make their fortunes in large lumber outfits. The proliferation of lumber industries in the Upper Midwest, inland Northwest, and the West Coast sparked the rise of a “lumberjack culture.” These were iconic axe- and saw-wielding strongmen, who worked in the deepest forests bringing down the largest trees to keep America warm and working. The job was not easy or safe, and special insurance was often available to those brave individuals who took up the task.
Depicting a Fractured Society: Civil War Maps
Overview
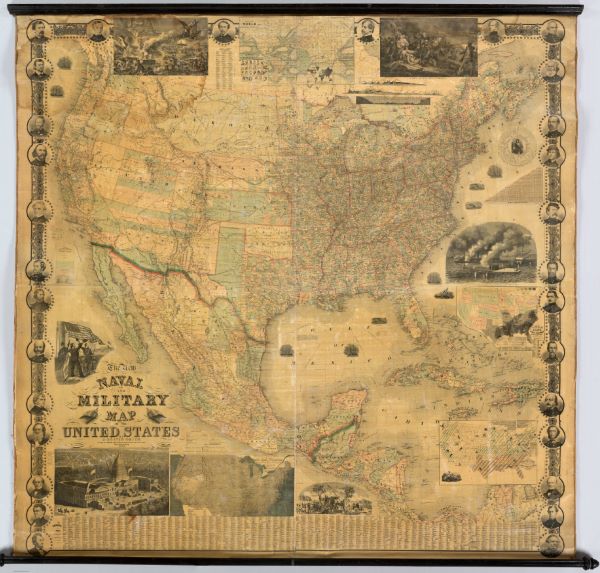
In the mid-nineteenth century, America’s division over slavery quickly escalated into the American Civil War, and with the war came a new appreciation for maps. These maps of wartime and national conflict served many purposes for the people of the United States, and were published by national journals such as Harpers, local presses, federal and state governments, and independent mapmakers. Many maps were purely utilitarian. But even those could be beautiful. Whatever their visual quality, maps served to describe and define new confederacies or lost ground, locate population groups such as slaves or enemy combatants, and even memorialize military strategies, battles, and heroes. In a country being torn apart, maps became representative of the grim realities of war and the division between North and South.
Populations and Polarities
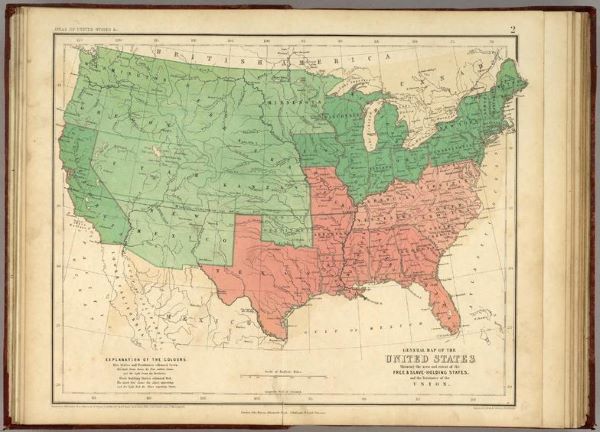
Prior to and throughout the war, maps were created to illustrate the division between slave-holding and free states. In some cases, maps provided specific population percentages of slaves within southern states. Often maps merely revealed the division as a binary between the North and the South, starkly illustrating the geography of slavery. In some cases, due to the uncertainty of the war’s outcome, this approach to mapmaking showed up in prominent publications, including the 1857 Atlas by Alexander Keith Johnston. In other cases, maps moved beyond the Mason-Dixon Line, polarizing the division of eastern states with those territories to the West. Different levels of granularity and precision allowed mappers to offer insight into to national, regional, state, and county-level demographics, providing information about a variety of communities and a range of political opinions.
In contrast to these published, widely circulated maps, other maps created to guide fleeing slaves to freedom existed long before the Civil War, but continued to be utilized until emancipation. They conveyed sensitive, and potentially dangerous, information and were available only to a select few. Underground Railroad maps, in particular, indicated “secure” routes and “safe” houses that would enable fleeing slaves to find shelter in northern states and Canada.
Envisioning War
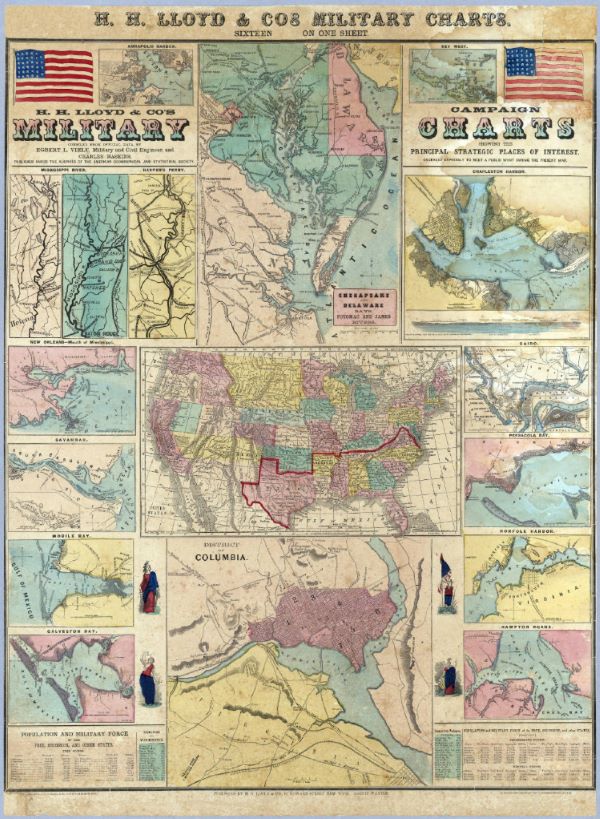
Maps of war, whether official military maps or commercial renderings, varied greatly. They depicted battlefields, strategic logistical points, and other relevant geographic information related to battle. They were visual guideposts for armies who were often traveling through foreign lands. And maps helped those on the home front better comprehend the news they read in the their daily papers and loved ones’ letters.
After the war these maps became sources of historical information, representing the brutal events that had occurred throughout the country. In the years and decades following the war, maps began to glorify famous scenes and commemorate battles and military leaders on both sides of the conflict. These maps illustrate how the country’s perspective changed and memory of the war’s horrors would diminish over time.
Travel and Tourism: Maps for Every American
Overview
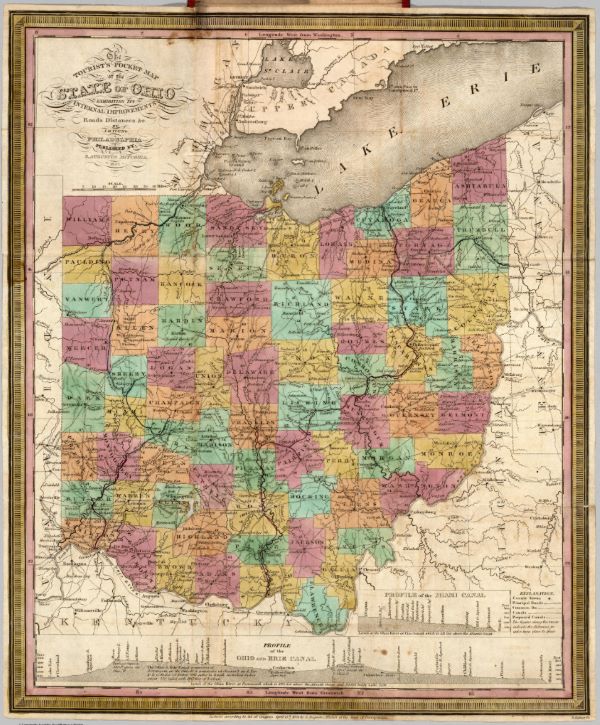
Prior to the proliferation of mainstream automobile sales, travel for Americans meant taking the train, trolley, or standard horse and carriage. Traveling by road was not for the faint of heart and was considered a potentially dangerous adventure, limited to those with a purpose.
In the early twentieth century, the motorcar was a rich man’s toy and road conditions were often dismal. In the 1920s, as cars became more available to the average citizen, road conditions improved and leisure travel increased in popularity. Maps became readily available at gas stations and were often made free by companies that would profit from car, fuel, and related commodities. Auto clubs also provided maps for a subscription fee. The Automobile Association of America (A.A.A.) perfected route-specific, spiral-bound maps called “TripTik” travel planners, which continue to be produced for their members today but saw their heyday during pre-GPS guided road trips. They included not just routes, but also road conditions and improvements, attractions, and other points of interest. They were highly detailed and heavy with text. This created a boom in road map creation that continued until the gas shortages of the 1970s.
“You Went Where?”: Souvenir Maps
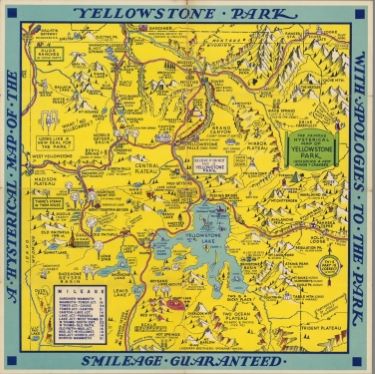
With the growth of passenger railroads and the development of the national highway system, the twentieth century saw a large increase in personal leisure travel. Events such as World’s Fairs and the rise of national sports leagues, as well as the creation of ambitious entertainment destinations like Disneyland and other amusement parks, brought about new types of maps designed for the American tourist.
While most travel maps provided accurate information about a given area to help plan transit routes, souvenir maps, created for regions or specific destinations, were designed to be both fun and functional. Cartoon imagery, photographs, and other art depicted popular tourist sites, local flora and fauna, and geographic highlights. Instead of purchasing these prior to a trip, travelers received them at their destination. Souvenir maps served the dual purpose of being a visually appealing keepsake as well a promotional tool to recruit more visitors.
Crafted by park owners, town tourism boards, and industry-specific stakeholders, souvenir maps were widely available starting in the 1930s and continue to be prominent today.
Alternate Routes
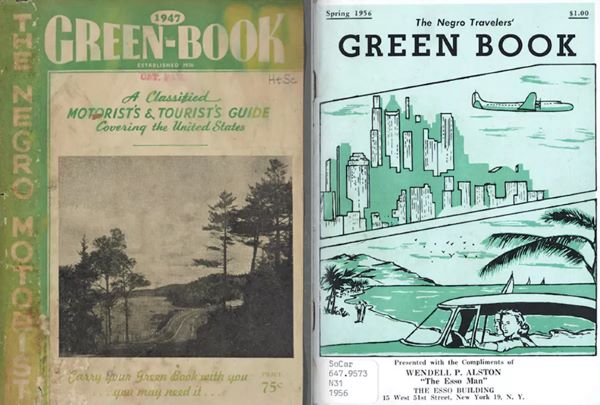
As the car became the dominant mode of transportation and travel in twentieth-century America, the realities of segregation limited options for travelers of color, reflected a larger culture of inequality. Prior to and during the Civil Rights Movement, segregation laws persisted throughout many areas in the country, while in others, climates of discrimination and violence without legal grounding limited access to businesses, lodging, and recreation. For many non-white travelers, reference materials and word-of-mouth recommendations were required to map a safe route across country.
Publications were released to accommodate these inequities in travel culture. For example, the Negro Travelers’ Green Book provided detailed listings and indexes of African American-owned businesses throughout the country where black travelers would feel comfortable dining and lodging as they vacationed or moved across country. Many of the five-million participants in the Second Great Migration (1941-1970)—African Americans who moved to urban centers in the North, Midwest, and West by car and bus—relied on travel resources like the Green Book to safely navigate their journeys.
New Travel Technologies
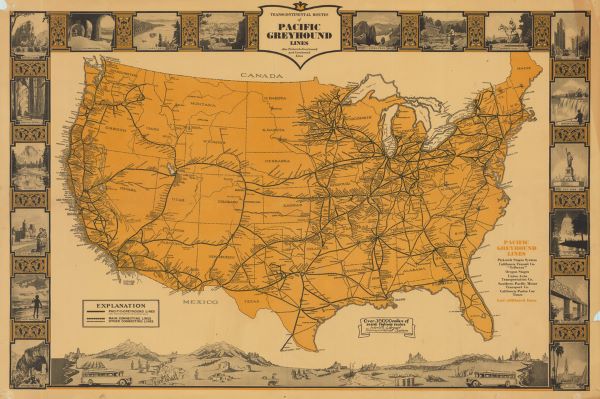
During the twentieth century, improvements in travel technology, combined with a new interstate network of reliable roads, gave Americans a dizzying array of travel choices. Trains got faster and more comfortable. Long-distance bus companies were born for both everyday and tourist-specific transportation. Cars got bigger and were designed to travel longer distances. And airlines were a traveler’s dream, creating the ultimate vision of luxury travel. These improvements are reflected in the travel maps and road atlases of the day, as the fascination with geography became less about mapping distances and more about seeing America as a whole. The leisurely steamboat cruises of the nineteenth century must have seemed quaint, compared to the hustle and bustle of train stations and hundreds of jetliners crisscrossing the sky each day.
Moving Forward
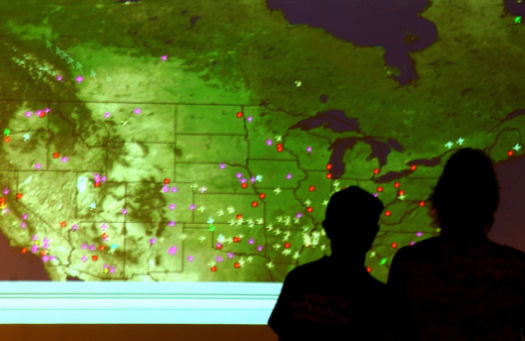
Today, travelers in the United States still use maps for familiar navigational purposes, but the maps they consult differ greatly from their counterparts centuries (and even decades) ago as they have been enhanced greatly by digital technologies and electronics.
The rise of Geographic Information Systems (GIS) and computer-based mapping shifted the static nature of older maps to a state of persistent revision and enhancement, making maps dynamic and more reliable. Geographic Positioning Systems (GPS), which allows users to locate themselves on a map using a personal device, offer precise tools for work and pleasure and are found in everything from phones to cars. The new geographic technologies have improved many aspects of modern life: online maps that serve as business directories and provide point-to-point directions by car, bus, or bicycle, flight maps that assist computer pilots and entertain long-distance air travelers, urban mapping applications that can identify crime, gas prices, and apartment rentals, and specialized research mapping solutions capable of providing insight into oceanographic trends and weather patterns.Despite specializations and specificity of the many types of maps available, they continue to be tools American use with passion. Most apps in the second decade of the 21st century, like FourSquare, Facebook, Twitter, and Instagram, have built in location-sharing systems, mapping our every move and enabling us to track our friends and our own whereabouts and to find our way through the digital and physical world at any moment. No longer are maps something we simply use; they have become a part of us.
This exhibition was created as part of the DPLA’s Digital Curation Program by the following students in Professor Helene Williams‘s capstone course at the Information School at the University of Washington: Greg Bem, Kili Bergau, Emily Felt, and Jessica Blanchard. Additional revisions and selections made by Greg Bem.
Published by the Digital Public Library of America (DPLA), September 2014, under the terms of a Creative Commons Attribution 3.0 Unported license.
