
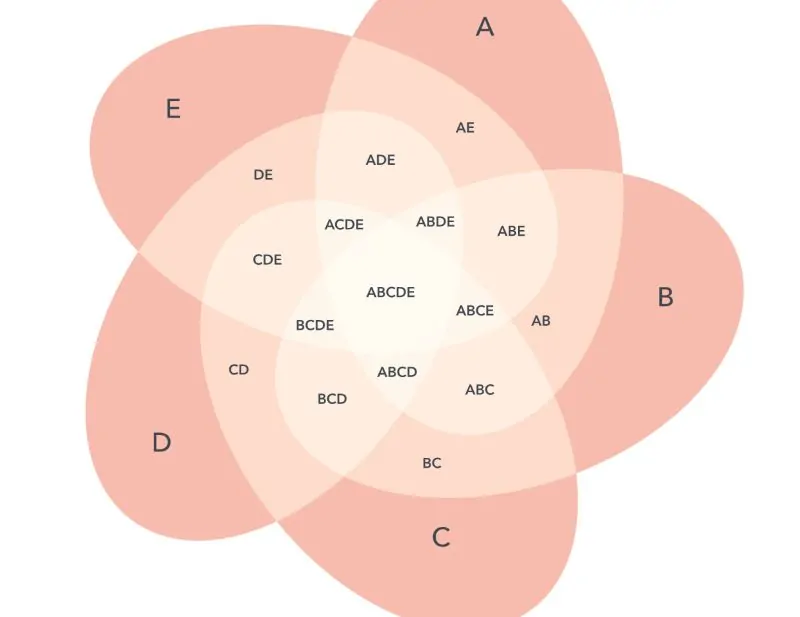
The usefulness of Venn diagrams in comparison of concepts, information organization, and understanding relationships among groups cannot be underestimated. These illustrations are used by both students and business groups for easy analysis and comparison of different alternatives. A clear idea about how to use this visual tool can make problem-solving and decision-making much easier in diverse situations.
The popularity of Venn diagrams continues to grow because they present information clearly and simply. A Venn diagram tutorial can help beginners understand the basics and address common challenges when comparing information. This article explains the practical uses of these diagrams for students and businesses in everyday situations.
Students Use Venn Diagrams to Improve Learning
1. They Can Compare Different Concepts in a Subject
Students can use Venn diagrams to compare different concepts and notice clear connections between related topics in class. This method helps them separate unique details from shared ideas without confusion. For example, students can compare characters, events, or theories to understand how different elements connect.
A clear diagram makes difficult topics easier as students see similarities and differences in a simple visual format. This approach supports better memory and allows them to recall important information before exams more confidently. It also gives learners a practical way to review lessons and explain their thoughts.
2. The Methods Improve Essay and Research Planning
A clear structure or outline is necessary to write an essay, report, or research project, isn’t it? Here, students can use this chart, which will help them collect and organize information between multiple topics. This is how it makes the whole planning process a lot more easy while reducing confusion.
Learners can compare opinions, themes, or arguments to create stronger points for their written assignments. The visual layout allows them to organize thoughts before they prepare their final responses or presentations. This simple method can improve focus and help students develop more organized academic work.
Here is what learners need to keep in mind while creating one:
- Pick clear topics before you place them into each circle.
- The overlapping areas should be smaller so that the comparison stays easy to read.
- Short keywords or labels are more useful in this instead of long, detailed sentences.
- Be aware of the similarities and differences so that the essay writing becomes easier.
- Check the layout so all ideas are shown fairly and clearly.
3. It Eases the Pressure of Math and Logical Problems
Does your child frequently avoid mathematical concepts like sets, groups, and logical relations? The simple format of the Venn diagram can be of great help as it easily shows how categories connect, which values belong together, and which do not. This makes complex problems feel more manageable.
Students can also use these illustrations to solve questions about probability and group relationships more easily. The clear arrangement of information helps them identify patterns and reach accurate conclusions. This practice can build stronger problem-solving skills through simple visual methods.
The following are other areas of math where this visual tool comes in handy:
- Set theory: showing unions, intersections, and differences between groups.
- Logical reasoning: testing statements using AND, OR, and NOT conditions.
- Divisibility and factors: comparing shared factors or multiples between numbers.
- Boolean algebra: representing true/false conditions and combined logical outcomes.
- Data classification: sorting values into categories based on shared properties.
4. They Can Organize Group Project Ideas
Group projects generally include different suggestions from different students with different opinions and ideas. A Venn diagram helps team members compare their thoughts and find common goals for projects. This creates a smoother way to organize discussions and decide suitable approaches together.
Students can place similar ideas in shared areas and keep separate suggestions clearly visible. This method encourages teamwork because every member can understand the contribution of others. It also helps groups create balanced plans before they begin their project work.
Businesses Use Venn Diagrams for Better Planning and Decisions
5. It Helps Compare Products Before Major Decisions
Businesses can use Venn diagrams to compare products and understand their similarities and differences. This visual method helps teams review features, benefits, and limitations before selecting suitable options. It provides a simple way to support decisions with organized information.
Companies can compare competitor products or different solutions during planning discussions. The illustration helps teams identify unique advantages and areas that require further improvement. This allows decision-makers to evaluate choices with better clarity and confidence.
6. They Can Understand Customer Groups and Needs Easily
Venn Diagrams are one of the ways businesses use to study different categories of customers and find the similarities between their interests and preferences. Marketing personnel can analyze the similarities and needs of diverse customers. Such flexibility helps teams create beneficial strategies to work on their target market.
A visual comparison makes customer research easier to understand for different team members. Businesses can recognize important patterns between customer groups and improve their communication methods. This approach supports better decisions about products, services, and promotional plans.
Here is what marketing teams can uncover about their customers:
- Shared preferences: interests or needs common across multiple customer segments.
- Unique traits: behaviors or preferences specific to just one group.
- Overlapping needs: demands that connect different customer types.
- Buying patterns: habits shared among customers within the same segment.
- Target audience gaps: unmet needs that competitors or products currently miss.
7. Organize Team Discussion Points
Business meetings sometimes include multiple ideas that require proper organization before final decisions. A Venn diagram helps teams arrange similar suggestions and separate unrelated viewpoints clearly. This structure allows employees to focus on important topics during discussions.
The common issues this method can help resolve during meetings and conferences:
- Miscommunication caused by unclear or overlapping suggestions.
- Repeated ideas being discussed without anyone noticing the overlap.
- Difficulty separating relevant points from off-topic ones.
- Confusion when multiple opinions need to be compared quickly.
- Slow decision-making due to scattered or disorganized input.
Teams can use these illustrations to find shared opinions and identify areas that need more attention. This method creates better communication between employees with different roles and responsibilities. It also helps leaders review ideas before selecting the best possible direction.
8. Analyze Data and Find Connections
Businesses can use these illustrations to compare data groups and identify useful relationships between categories. This helps teams understand information that may appear complicated in traditional reports or documents. The visual format makes important connections easier to recognize and explain.
Companies can review different data sets to discover patterns that support better strategies. The diagram allows employees to present findings in a clear and simple manner. This makes information easier for teams to discuss and apply during planning. Venn diagrams are simple tools for comparing information, spotting links between pieces of data, and organizing ideas perfectly. The benefits of using these illustrations can be explained well in the course of a Venn diagram tutorial for students and businesses. Always join tutorials from trusted resources to conceptualize the steps properly.
About the Author